Bitcoin price failed again to clear the $38,500 resistance zone. BTC is consolidating above the 100 hourly SMA and might attempt another increase.
Bitcoin is still facing heavy resistance near the $38,500 zone.
The price is trading above $37,400 and the 100 hourly Simple moving average.
There is a key bullish trend line forming with support near $37,350 on the hourly chart of the BTC/USD pair (data feed from Kraken).
The pair could make another attempt to clear the $38,500 resistance unless it breaks below $37,350.
Bitcoin price remained well-bid above the $37,500 support zone. BTC climbed higher above the $38,000 level and made another attempt to clear the $38,400 resistance zone.
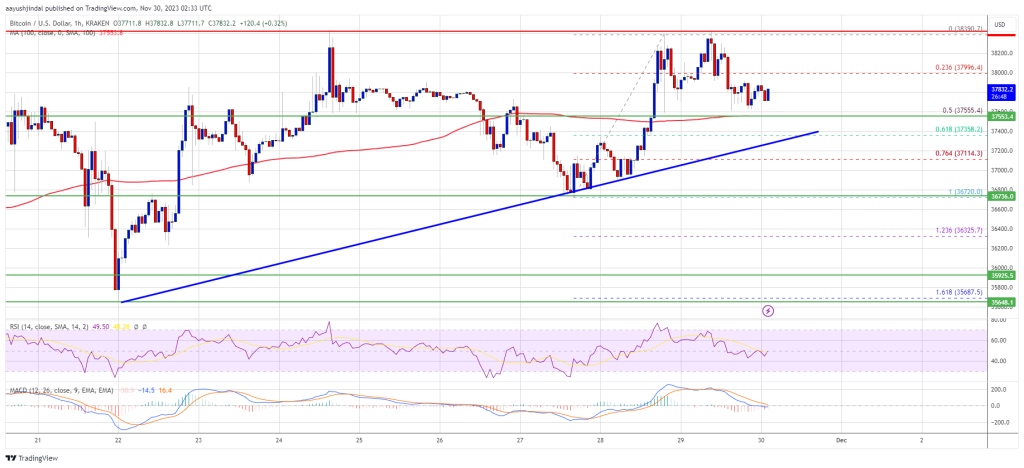
However, the bulls failed to gain strength and the price peaked near $38,400. It is again correcting gains and trading below the 23.6% Fib retracement level of the upward move from the $36,721 swing low to the $38,390 high.
Bitcoin is now trading above $37,400 and the 100 hourly Simple moving average. There is also a key bullish trend line forming with support near $37,350 on the hourly chart of the BTC/USD pair.
On the upside, immediate resistance is near the $38,200 level. The first major resistance is forming near $38,400. The main resistance is still near the $38,500 level. A close above the $38,500 resistance might start a fresh rally.
Source: BTCUSD on TradingView.com
The next key resistance could be near $39,200, above which BTC could climb toward the $39,500 level. Any more gains might send BTC toward the $40,000 resistance.
If Bitcoin fails to rise above the $38,400 resistance zone, it could start another decline. Immediate support on the downside is near the $37,550 level or the 50% Fib retracement level of the upward move from the $36,721 swing low to the $38,390 high.
The next major support is near $37,350 and the trend line. If there is a move below $37,350, there is a risk of more downsides. In the stated case, the price could decline toward the $36,720 support in the near term.
Technical indicators:
Hourly MACD – The MACD is now losing pace in the bullish zone.
Hourly RSI (Relative Strength Index) – The RSI for BTC/USD is now near the 50 level.
Major Support Levels – $37,550, followed by $37,350.
Major Resistance Levels – $38,400, $38,500, and $39,200.
[#item_full_content]NewsBTCRead MoreHeavy supply concentration and large options positioning continue to suppress volatility and keep bitcoin range-bound.Read…
As Bitcoin (BTC) recovers from its recent drop below the $75,000 support, some market observers…
Bitcoin’s recent drop below key support may have been more than just a bearish breakdown.…
Enflux says “the bid is there” but no one is adding size, while Glassnode data…
A closely watched on-chain indicator has returned to a range that has marked major turning…
Bitcoin price started a downside correction from the $78,000 zone. BTC is consolidating and might…