Bitcoin price failed again to clear the $38,500 resistance zone. BTC is consolidating above the 100 hourly SMA and might attempt another increase.
Bitcoin is still facing heavy resistance near the $38,500 zone.
The price is trading above $37,400 and the 100 hourly Simple moving average.
There is a key bullish trend line forming with support near $37,350 on the hourly chart of the BTC/USD pair (data feed from Kraken).
The pair could make another attempt to clear the $38,500 resistance unless it breaks below $37,350.
Bitcoin price remained well-bid above the $37,500 support zone. BTC climbed higher above the $38,000 level and made another attempt to clear the $38,400 resistance zone.
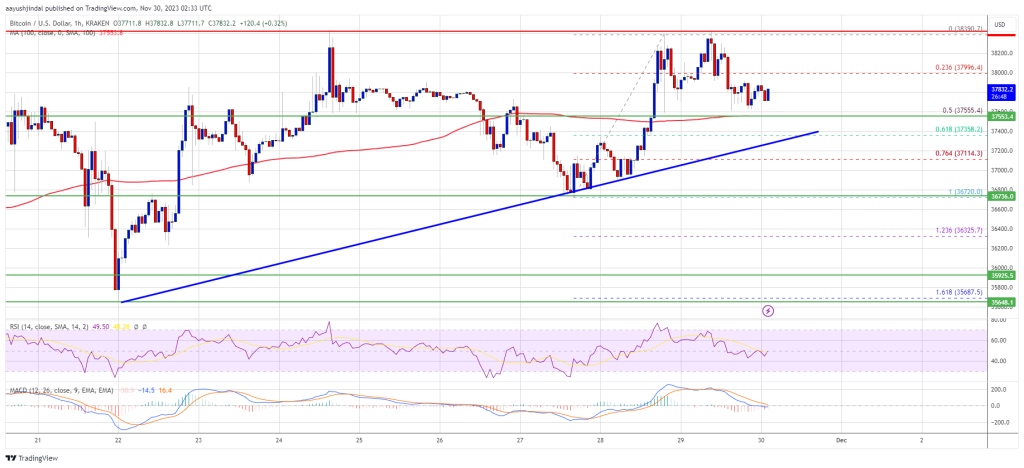
However, the bulls failed to gain strength and the price peaked near $38,400. It is again correcting gains and trading below the 23.6% Fib retracement level of the upward move from the $36,721 swing low to the $38,390 high.
Bitcoin is now trading above $37,400 and the 100 hourly Simple moving average. There is also a key bullish trend line forming with support near $37,350 on the hourly chart of the BTC/USD pair.
On the upside, immediate resistance is near the $38,200 level. The first major resistance is forming near $38,400. The main resistance is still near the $38,500 level. A close above the $38,500 resistance might start a fresh rally.
Source: BTCUSD on TradingView.com
The next key resistance could be near $39,200, above which BTC could climb toward the $39,500 level. Any more gains might send BTC toward the $40,000 resistance.
If Bitcoin fails to rise above the $38,400 resistance zone, it could start another decline. Immediate support on the downside is near the $37,550 level or the 50% Fib retracement level of the upward move from the $36,721 swing low to the $38,390 high.
The next major support is near $37,350 and the trend line. If there is a move below $37,350, there is a risk of more downsides. In the stated case, the price could decline toward the $36,720 support in the near term.
Technical indicators:
Hourly MACD – The MACD is now losing pace in the bullish zone.
Hourly RSI (Relative Strength Index) – The RSI for BTC/USD is now near the 50 level.
Major Support Levels – $37,550, followed by $37,350.
Major Resistance Levels – $38,400, $38,500, and $39,200.
[#item_full_content]NewsBTCRead MoreBitcoin Magazine Bitcoin Pops After Supreme Court Strikes Down Trump’s Tariffs The Supreme Court of…
As has been typical in crypto markets of late, even the most modest move higher…
Bitcoin Magazine Bitcoin’s 50% Slide: Quantum Scare or Capital Rotation? Bitcoin’s 46% decline from its…
Michael Saylor kept buying while the market slid, and he did it out loud: “Neven…
Your day-ahead look for Feb. 20, 2026Read MoreCoinDesk: Bitcoin, Ethereum, Crypto News and Price Data[#item_full_content]
Bitcoin rebounded above $68,000 as ETF outflows hit $6.8 billion and funding flips positive. A…