Bitcoin price is struggling below the $43,500 resistance zone. BTC could start another decline if it stays below the 100 hourly SMA.
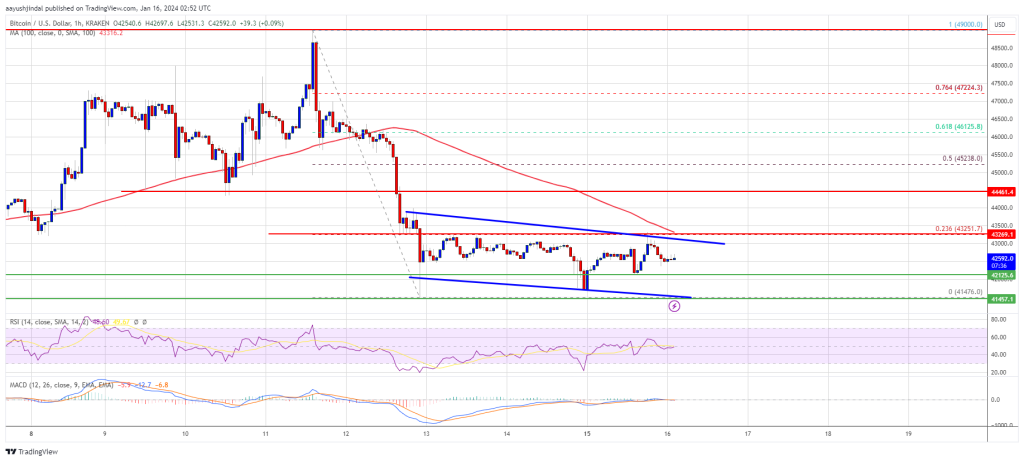
Bitcoin price started a major decline from the $49,000 resistance zone.
The price is trading below $43,250 and the 100 hourly Simple moving average.
There is a key declining channel forming with resistance near $43,050 on the hourly chart of the BTC/USD pair (data feed from Kraken).
The pair could start a fresh decline if it stays below the $43,250 resistance zone.
Bitcoin price started a major decline from the $49,000 resistance zone. BTC traded below the $46,500 and $45,000 support levels to enter a short-term bearish zone.
The bears even pushed the price below the $42,500 support zone before the bulls appeared. A low was formed near $41,476 and the price is now consolidating losses. It recovered a few points above the $42,000 level. The price tested the 23.6% Fib retracement level of the key drop from the $49,000 swing high to the $41,476 low.
Bitcoin is now trading below $43,250 and the 100 hourly Simple moving average. There is also a key declining channel forming with resistance near $43,050 on the hourly chart of the BTC/USD pair.
On the upside, immediate resistance is near the $43,000 level and the channel zone. The first major resistance is $43,250 or the 100 hourly Simple moving average. A clear move above the $43,250 resistance could send the price toward the $44,450 resistance.
Source: BTCUSD on TradingView.com
The next resistance is now forming near the $45,250 level. It is near the 50% Fib retracement level of the key drop from the $49,000 swing high to the $41,476 low. A close above the $45,250 level could start a strong increase and send the price higher. The next major resistance sits at $47,000.
If Bitcoin fails to rise above the $43,250 resistance zone, it could start a fresh decline. Immediate support on the downside is near the $42,120 level.
The next major support is $41,500. If there is a close below $41,500, the price could gain bearish momentum. In the stated case, the price could drop toward the $40,000 support in the near term.
Technical indicators:
Hourly MACD – The MACD is now losing pace in the bearish zone.
Hourly RSI (Relative Strength Index) – The RSI for BTC/USD is now below the 50 level.
Major Support Levels – $42,120, followed by $41,500.
Major Resistance Levels – $43,050, $43,250, and $44,450.
[#item_full_content]NewsBTCRead MoreStrategy’s stock is trading below the value of its own Bitcoin holdings — an unusual…
The cryptocurrency community pushed back, with Michael Saylor saying Bitcoin has no issuer, promoter, or…
Crypto pundit Crypto Bully has shared his base case for Bitcoin and what to expect…
The past week recorded a significant change in the Bitcoin price action, where there was…
The largest publicly traded corporate holder of bitcoin would need to buy roughly 6,158 BTC…
On-chain analytics firm Glassnode has highlighted how Bitcoin has only seen a relatively thin accumulation…