Bitcoin price is still facing resistance below $17,000. BTC could decline heavily if there is a clear move below the $16,000 support zone.
Bitcoin is still showing bearish signs below the $16,800 and $17,000 resistance levels.
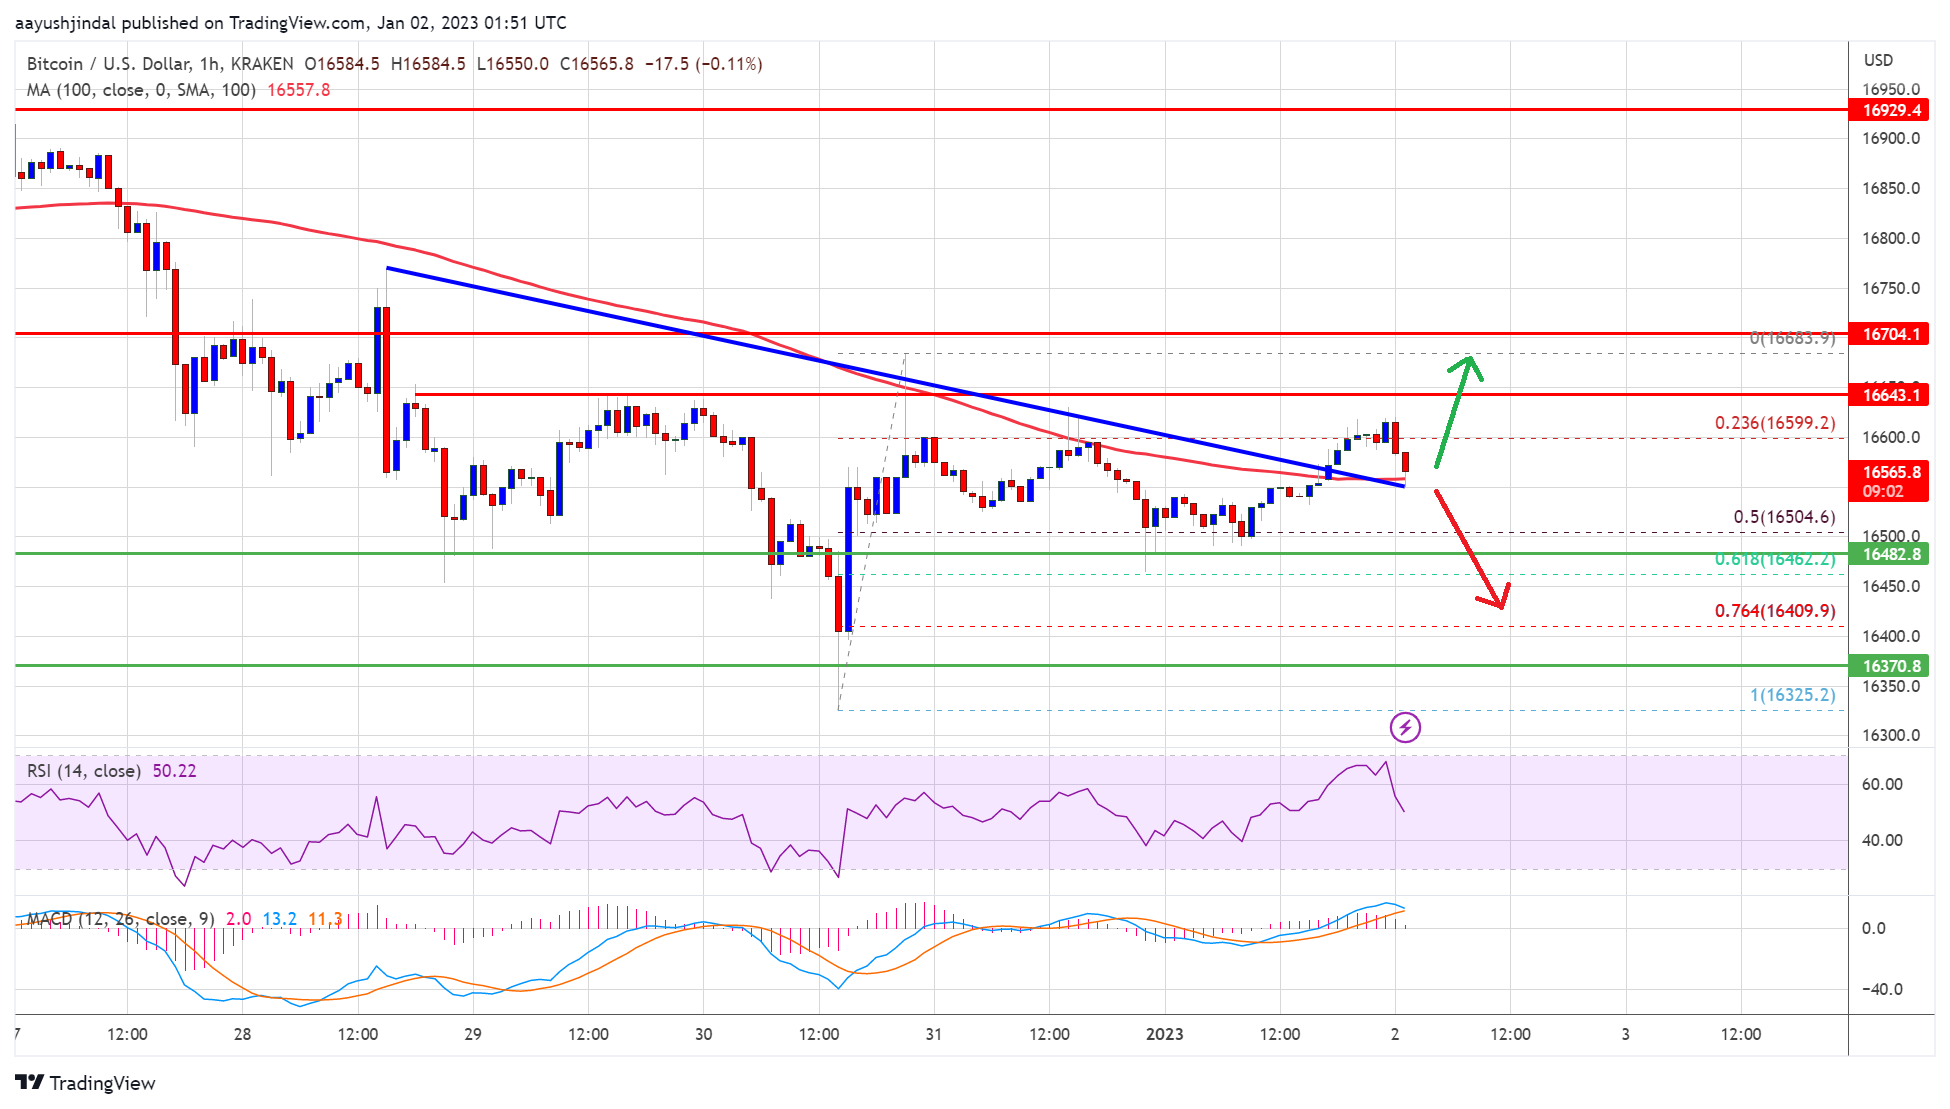
The price is trading above $16,500 and the 100 hourly simple moving average.
There was a break above a key bearish trend line with resistance near $16,550 on the hourly chart of the BTC/USD pair (data feed from Kraken).
The pair could resume its decline if there is a clear move below the $16,000 support.
Bitcoin price spiked below the $16,500 support zone. However, BTC bulls were active above the $16,200 level. The price traded as low as $16,325 and recently started an upside correction.
There was a minor recovery wave above the $16,500 level. The price climbed above the $16,600 level and the 100 hourly simple moving average. However, the bears were active near the $16,680 zone. A high was formed near $16,683 and the price corrected lower.
Bitcoin price declined below 23.6% Fib retracement level of the upward move from the $16,325 low to $16,683 high. It found support near the $16,500 level.
The price is trading above the 50% Fib retracement level of the upward move from the $16,325 low to $16,683 high. It is also above $16,500 and the 100 hourly simple moving average. On the upside, an immediate resistance is near the $16,600 level.
Source: BTCUSD on TradingView.com
The first major resistance is near the $16,680 zone. The next major resistance is near the $16,800 level. The key breakout zone is still near the $17,000 level. A clear move above the $17,000 resistance might start a fresh increase in the near term.
If bitcoin fails to start a recovery wave above the $16,650 resistance, it could start another decline. An immediate support on the downside is near the $16,500 level.
The next major support is near the $16,350 level. A clear move below the $16,350 support might spark a move towards the $16,000 level. Any more losses might send the price towards $15,500.
Technical indicators:
Hourly MACD – The MACD is now losing pace in the bullish zone.
Hourly RSI (Relative Strength Index) – The RSI for BTC/USD is now near the 50 level.
Major Support Levels – $16,500, followed by $16,350.
Major Resistance Levels – $16,600, $16,800 and $17,000.
Bitcoin price is still facing resistance below $17,000. BTC could decline heavily if there is a clear move below the $16,000 support zone.
Bitcoin is still showing bearish signs below the $16,800 and $17,000 resistance levels.
The price is trading above $16,500 and the 100 hourly simple moving average.
There was a break above a key bearish trend line with resistance near $16,550 on the hourly chart of the BTC/USD pair (data feed from Kraken).
The pair could resume its decline if there is a clear move below the $16,000 support.
Bitcoin price spiked below the $16,500 support zone. However, BTC bulls were active above the $16,200 level. The price traded as low as $16,325 and recently started an upside correction.
There was a minor recovery wave above the $16,500 level. The price climbed above the $16,600 level and the 100 hourly simple moving average. However, the bears were active near the $16,680 zone. A high was formed near $16,683 and the price corrected lower.
Bitcoin price declined below 23.6% Fib retracement level of the upward move from the $16,325 low to $16,683 high. It found support near the $16,500 level.
The price is trading above the 50% Fib retracement level of the upward move from the $16,325 low to $16,683 high. It is also above $16,500 and the 100 hourly simple moving average. On the upside, an immediate resistance is near the $16,600 level.
Source: BTCUSD on TradingView.com
The first major resistance is near the $16,680 zone. The next major resistance is near the $16,800 level. The key breakout zone is still near the $17,000 level. A clear move above the $17,000 resistance might start a fresh increase in the near term.
If bitcoin fails to start a recovery wave above the $16,650 resistance, it could start another decline. An immediate support on the downside is near the $16,500 level.
The next major support is near the $16,350 level. A clear move below the $16,350 support might spark a move towards the $16,000 level. Any more losses might send the price towards $15,500.
Technical indicators:
Hourly MACD – The MACD is now losing pace in the bullish zone.
Hourly RSI (Relative Strength Index) – The RSI for BTC/USD is now near the 50 level.
Major Support Levels – $16,500, followed by $16,350.
Major Resistance Levels – $16,600, $16,800 and $17,000.
Tags: bitcoinbitcoin pricebtcusdBTCUSDTxbtusd
NewsBTCRead More
The vast majority of the activity was concentrated in BlackRock’s IBIT product accounting for nearly…
Your day-ahead look for July 27, 2026Read MoreCoinDesk: Bitcoin, Ethereum, Crypto News and Price Data[#item_full_content]
CoinEx's Jeff Ko sees bitcoin staying range-bound near $65,000 while retreating oil, a 4.7% 10-year…
ETH outperforms BTC, hinting at potential altcoin rally, as the U.S. and Iran hold fire…
BitMEX is facing a proposed class action in the Southern District of New York seeking…
Bitcoin Magazine Morgan Stanley Bitcoin ETF Nearly Notches $400M in Assets Wall Street giant Morgan…