Bitcoin price is still facing resistance below $17,000. BTC could decline heavily if there is a clear move below the $16,000 support zone.
Bitcoin is still showing bearish signs below the $16,800 and $17,000 resistance levels.
The price is trading above $16,500 and the 100 hourly simple moving average.
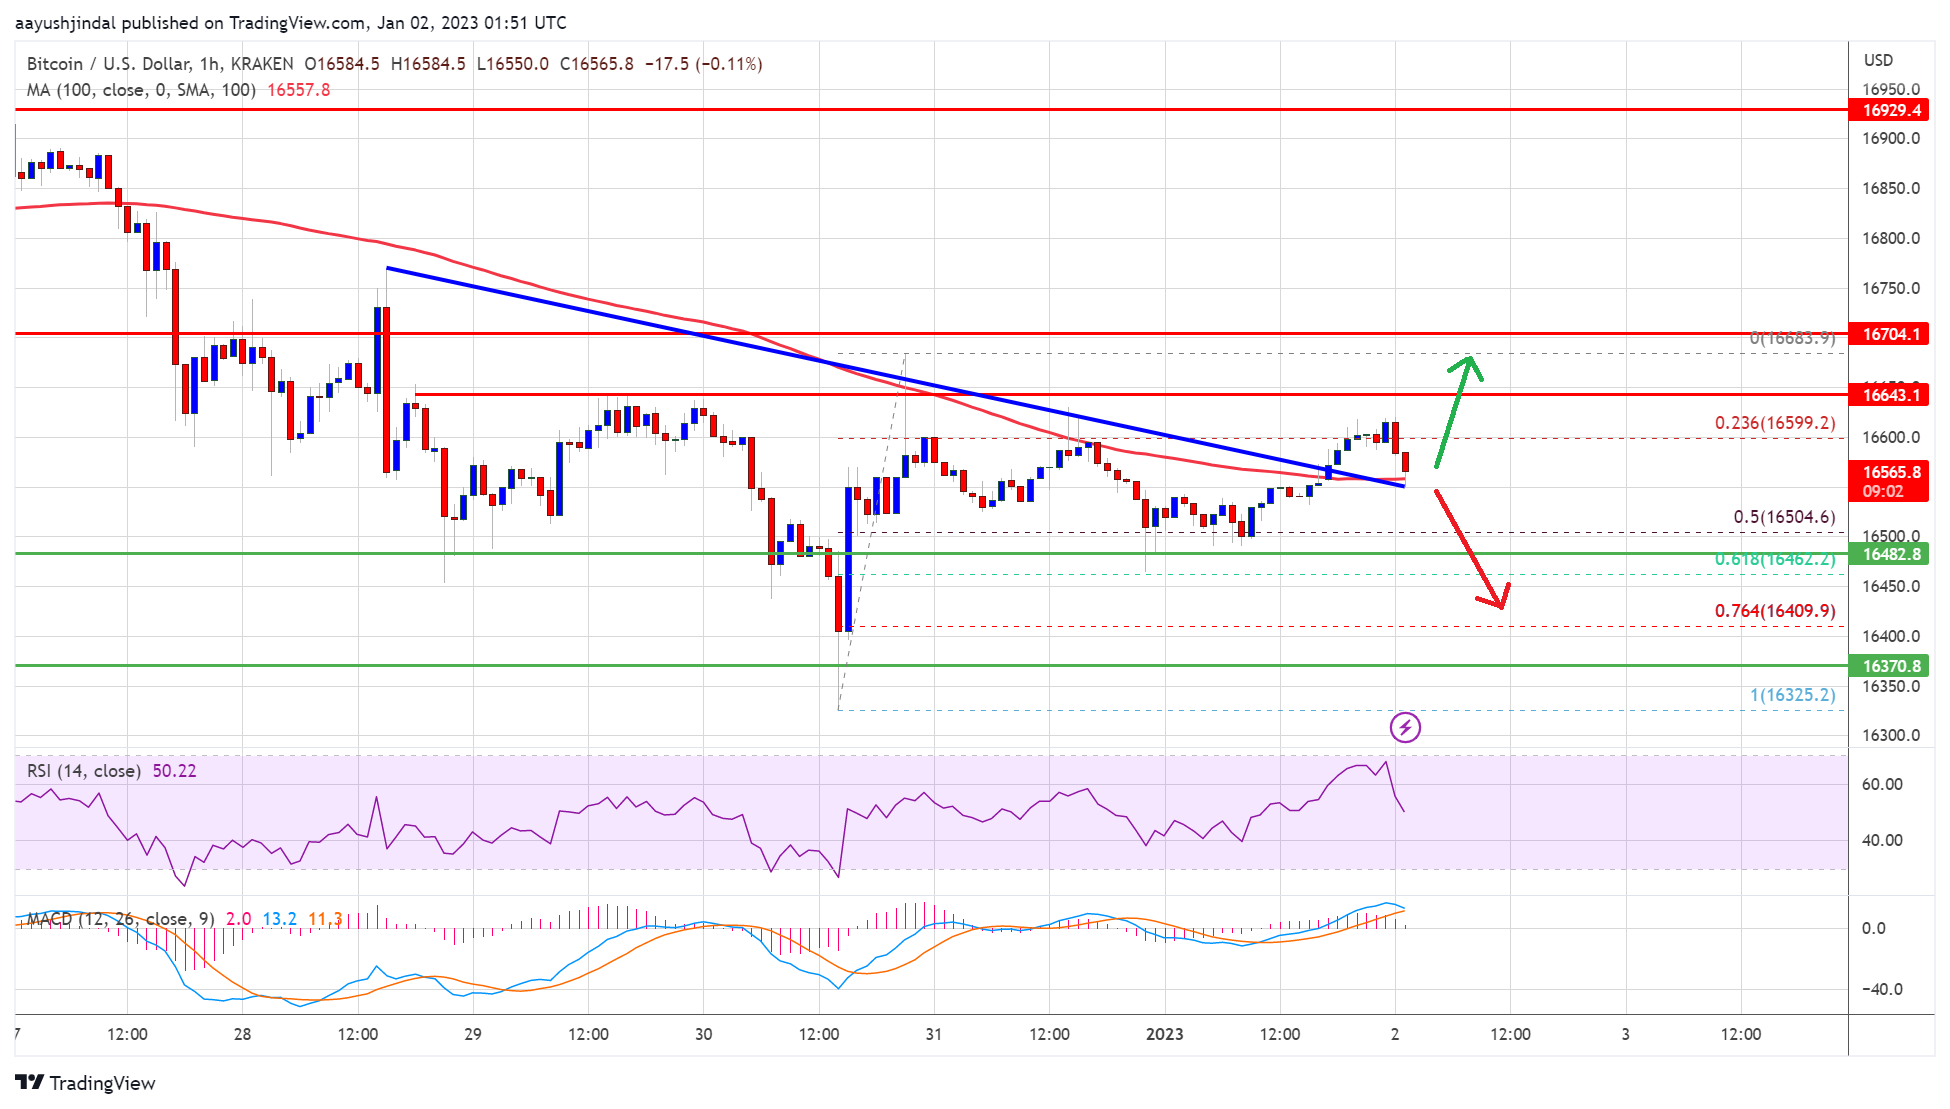
There was a break above a key bearish trend line with resistance near $16,550 on the hourly chart of the BTC/USD pair (data feed from Kraken).
The pair could resume its decline if there is a clear move below the $16,000 support.
Bitcoin price spiked below the $16,500 support zone. However, BTC bulls were active above the $16,200 level. The price traded as low as $16,325 and recently started an upside correction.
There was a minor recovery wave above the $16,500 level. The price climbed above the $16,600 level and the 100 hourly simple moving average. However, the bears were active near the $16,680 zone. A high was formed near $16,683 and the price corrected lower.
Bitcoin price declined below 23.6% Fib retracement level of the upward move from the $16,325 low to $16,683 high. It found support near the $16,500 level.
The price is trading above the 50% Fib retracement level of the upward move from the $16,325 low to $16,683 high. It is also above $16,500 and the 100 hourly simple moving average. On the upside, an immediate resistance is near the $16,600 level.
Source: BTCUSD on TradingView.com
The first major resistance is near the $16,680 zone. The next major resistance is near the $16,800 level. The key breakout zone is still near the $17,000 level. A clear move above the $17,000 resistance might start a fresh increase in the near term.
If bitcoin fails to start a recovery wave above the $16,650 resistance, it could start another decline. An immediate support on the downside is near the $16,500 level.
The next major support is near the $16,350 level. A clear move below the $16,350 support might spark a move towards the $16,000 level. Any more losses might send the price towards $15,500.
Technical indicators:
Hourly MACD – The MACD is now losing pace in the bullish zone.
Hourly RSI (Relative Strength Index) – The RSI for BTC/USD is now near the 50 level.
Major Support Levels – $16,500, followed by $16,350.
Major Resistance Levels – $16,600, $16,800 and $17,000.
Bitcoin price is still facing resistance below $17,000. BTC could decline heavily if there is a clear move below the $16,000 support zone.
Bitcoin is still showing bearish signs below the $16,800 and $17,000 resistance levels.
The price is trading above $16,500 and the 100 hourly simple moving average.
There was a break above a key bearish trend line with resistance near $16,550 on the hourly chart of the BTC/USD pair (data feed from Kraken).
The pair could resume its decline if there is a clear move below the $16,000 support.
Bitcoin price spiked below the $16,500 support zone. However, BTC bulls were active above the $16,200 level. The price traded as low as $16,325 and recently started an upside correction.
There was a minor recovery wave above the $16,500 level. The price climbed above the $16,600 level and the 100 hourly simple moving average. However, the bears were active near the $16,680 zone. A high was formed near $16,683 and the price corrected lower.
Bitcoin price declined below 23.6% Fib retracement level of the upward move from the $16,325 low to $16,683 high. It found support near the $16,500 level.
The price is trading above the 50% Fib retracement level of the upward move from the $16,325 low to $16,683 high. It is also above $16,500 and the 100 hourly simple moving average. On the upside, an immediate resistance is near the $16,600 level.
Source: BTCUSD on TradingView.com
The first major resistance is near the $16,680 zone. The next major resistance is near the $16,800 level. The key breakout zone is still near the $17,000 level. A clear move above the $17,000 resistance might start a fresh increase in the near term.
If bitcoin fails to start a recovery wave above the $16,650 resistance, it could start another decline. An immediate support on the downside is near the $16,500 level.
The next major support is near the $16,350 level. A clear move below the $16,350 support might spark a move towards the $16,000 level. Any more losses might send the price towards $15,500.
Technical indicators:
Hourly MACD – The MACD is now losing pace in the bullish zone.
Hourly RSI (Relative Strength Index) – The RSI for BTC/USD is now near the 50 level.
Major Support Levels – $16,500, followed by $16,350.
Major Resistance Levels – $16,600, $16,800 and $17,000.
Tags: bitcoinbitcoin pricebtcusdBTCUSDTxbtusd
NewsBTCRead More
The Financial Times and Peter Schiff were among the no-coiners giving themselves pats on the…
The Polymarket bet is a reminder that the weirdest corners of crypto are sometimes the…
Bitcoin Magazine Bitcoin Price Reclaims $71,000 as Institutions Buy the Dip and Retail Interest Surges…
Bitcoin Magazine Bithumb Bitcoin Blunder Sends $44 Billion to Users, Rattles Crypto Markets South Korean…
Recent on-chain data shows that the Bitcoin price is currently at an important phase, raising…
Since reaching its current all-time-high price of $126,000 in October last year, the Bitcoin market…