Bitcoin price rallied and tested the $66,500 zone. BTC is now consolidating gains and might attempt another increase toward $67,500.
Bitcoin started a consolidation phase from the $66,500 resistance zone.
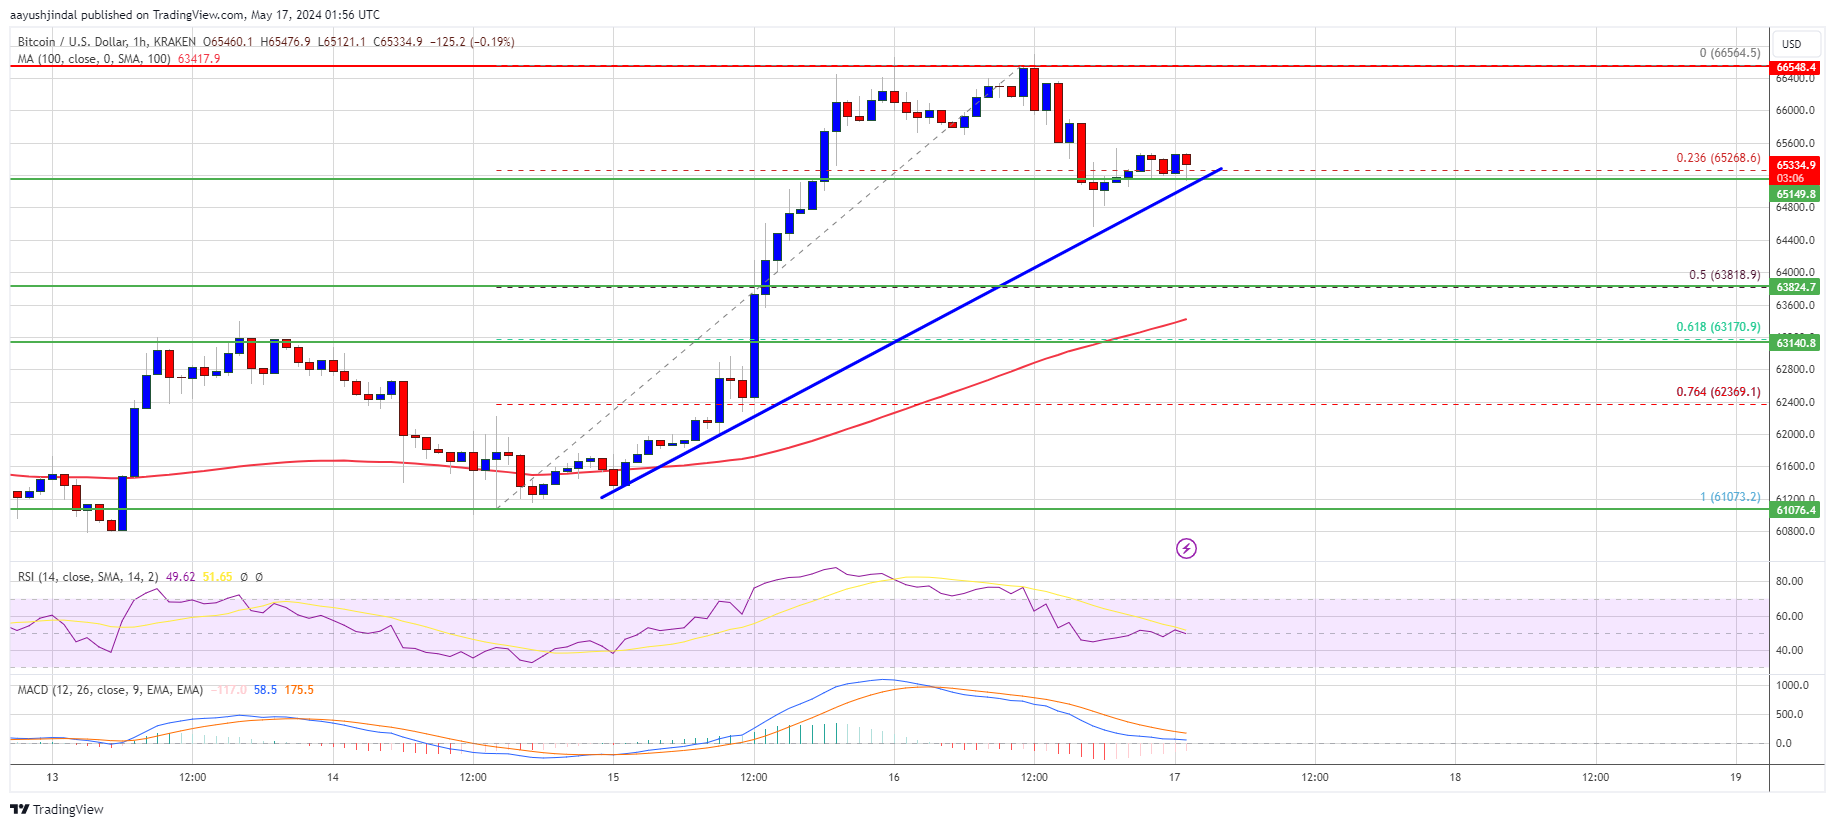
The price is trading above $65,000 and the 100 hourly Simple moving average.
There is a key bullish trend line forming with support at $65,150 on the hourly chart of the BTC/USD pair (data feed from Kraken).
The pair could start another increase unless the bears push it below $63,800.
Bitcoin price formed a base and started a fresh increase above the $63,500 level. BTC even cleared the $65,500 resistance and tested the $66,500 region. A new weekly high was formed at $66,565 and the price is now consolidating gains.
There was a minor decline below the $66,000 level. The price dipped below the 23.6% Fib retracement level of the upward move from the $61,073 swing low to the $66,565 high.
Bitcoin price is now trading above $65,000 and the 100 hourly Simple moving average. There is also a key bullish trend line forming with support at $65,150 on the hourly chart of the BTC/USD pair. Immediate resistance is near the $65,600 level.
The first major resistance could be $66,000. The next key resistance could be $66,500. A clear move above the $66,500 resistance might send the price higher. In the stated case, the price could rise and test the $67,200 resistance.
If the bulls remain in action, the price could rise toward the $68,000 resistance zone. Any more gains might send BTC toward the $70,000 barrier.
If Bitcoin fails to climb above the $66,000 resistance zone, it could continue to move down. Immediate support on the downside is near the $65,150 level and the trend line.
The first major support is $64,200. The main support is now forming near $63,800 or the 50% Fib retracement level of the upward move from the $61,073 swing low to the $66,565 high. Any more losses might send the price toward the $63,150 support zone in the near term.
Technical indicators:
Hourly MACD – The MACD is now losing pace in the bullish zone.
Hourly RSI (Relative Strength Index) – The RSI for BTC/USD is now above the 50 level.
Major Support Levels – $65,150, followed by $63,800.
Major Resistance Levels – $66,000, $66,500, and $67,200.
[#item_full_content]NewsBTCRead MoreDespite stabilizing spot prices, investors remain defensive, with leveraged speculation cooling and realized volatility dropping…
Crypto analyst Ardi has pointed to a bear market divergence to explain what has been…
Bitcoin is hovering near the $71,000 mark, consolidating after recent swings as the market digests…
First-quarter purchases have reached 89,618 BTC so far, the most since fourth-quarter 2024, and the…
Bitcoin (BTC) is showing early signs of a prolonged decline after peaking in October 2025.…
According to a recent on-chain data evaluation, the Bitcoin price might not be seeing a…