Bitcoin price rallied further toward $58,000. BTC is now consolidating gains and might soon attempt more gains toward the $60,000 resistance.
Bitcoin price is consolidating gains below the $57,500 resistance zone.
The price is trading above $56,000 and the 100 hourly Simple moving average.
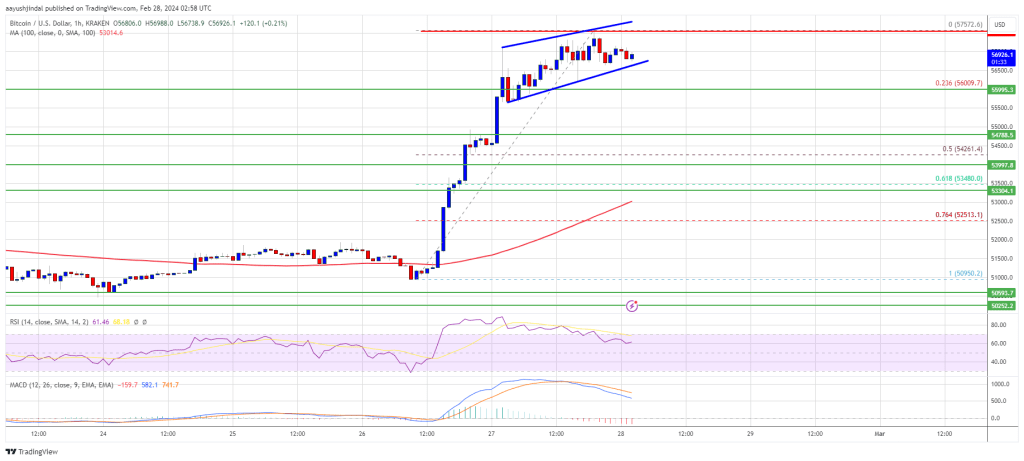
There is a rising channel forming with resistance near $57,650 on the hourly chart of the BTC/USD pair (data feed from Kraken).
The pair could extend its current rally toward the $60,000 resistance zone.
Bitcoin price extended its rally above the $55,000 resistance zone. BTC gained bullish momentum after it broke the $55,500 and $56,000 resistance levels. There was also a spike above the $57,000 resistance zone.
A new multi-week high is formed near $57,572 and the price is now consolidating gains. There was a minor decline below the $57,000 level, but the price is still above the 23.6% Fib retracement level of the recent wave from the $50,950 swing low to the $57,572 high.
Bitcoin is now trading above $56,000 and the 100 hourly Simple moving average. Immediate resistance is near the $57,200 level. The next key resistance could be $57,500.
Source: BTCUSD on TradingView.com
There is also a rising channel forming with resistance near $57,650 on the hourly chart of the BTC/USD pair, above which the price could rise toward the $58,000 resistance zone. If the bulls remain in action, the price could even surpass $58,000 and test $58,800. The main hurdle for them is visible near the $60,000 zone.
If Bitcoin fails to rise above the $57,500 resistance zone, it could start a downside correction. Immediate support on the downside is near the $56,800 level.
The first major support is $56,000. If there is a close below $56,000, the price could start a decent pullback toward the 50% Fib retracement level of the recent wave from the $50,950 swing low to the $57,572 high at $54,250. Any more losses might send the price toward the $53,200 support zone.
Technical indicators:
Hourly MACD – The MACD is now losing pace in the bullish zone.
Hourly RSI (Relative Strength Index) – The RSI for BTC/USD is now above the 50 level.
Major Support Levels – $56,800, followed by $56,000.
Major Resistance Levels – $57,500, $57,650, and $58,000.
[#item_full_content]NewsBTCRead MoreBitcoin price started a decent increase above $68,000 but failed at $70,000. BTC is now…
Bitcoin (BTC) has wrapped up February with its fifth straight monthly loss, marking only the…
Crypto Exchange-Traded Products (ETPs), led by Bitcoin (BTC) funds, have broken their one-month negative streak…
Bitcoin has remained in a consolidation phase since its early February breakdown below the $70,000…
The Bitcoin and Ethereum prices plunged sharply over the weekend as missiles flew across the…
Post ContentRead MoreCoinDesk: Bitcoin, Ethereum, Crypto News and Price Data[#item_full_content]