Bitcoin price is facing resistance near the $21,500 zone. BTC could correct lower if there is a clear move below the $20,880 support zone.
Bitcoin seems to be facing a strong resistance near the $21,450 and $21,500 levels.
The price is trading above $20,500 and the 100 hourly simple moving average.
There is a key bullish trend line forming with support near $20,920 on the hourly chart of the BTC/USD pair (data feed from Kraken).
The pair could start a downside correction below the $20,880 and $20,750 support levels.
Bitcoin price started a strong increase above the $20,000 resistance zone. BTC was able to climb above the $20,500 and $21,000 levels to start a major uptrend.
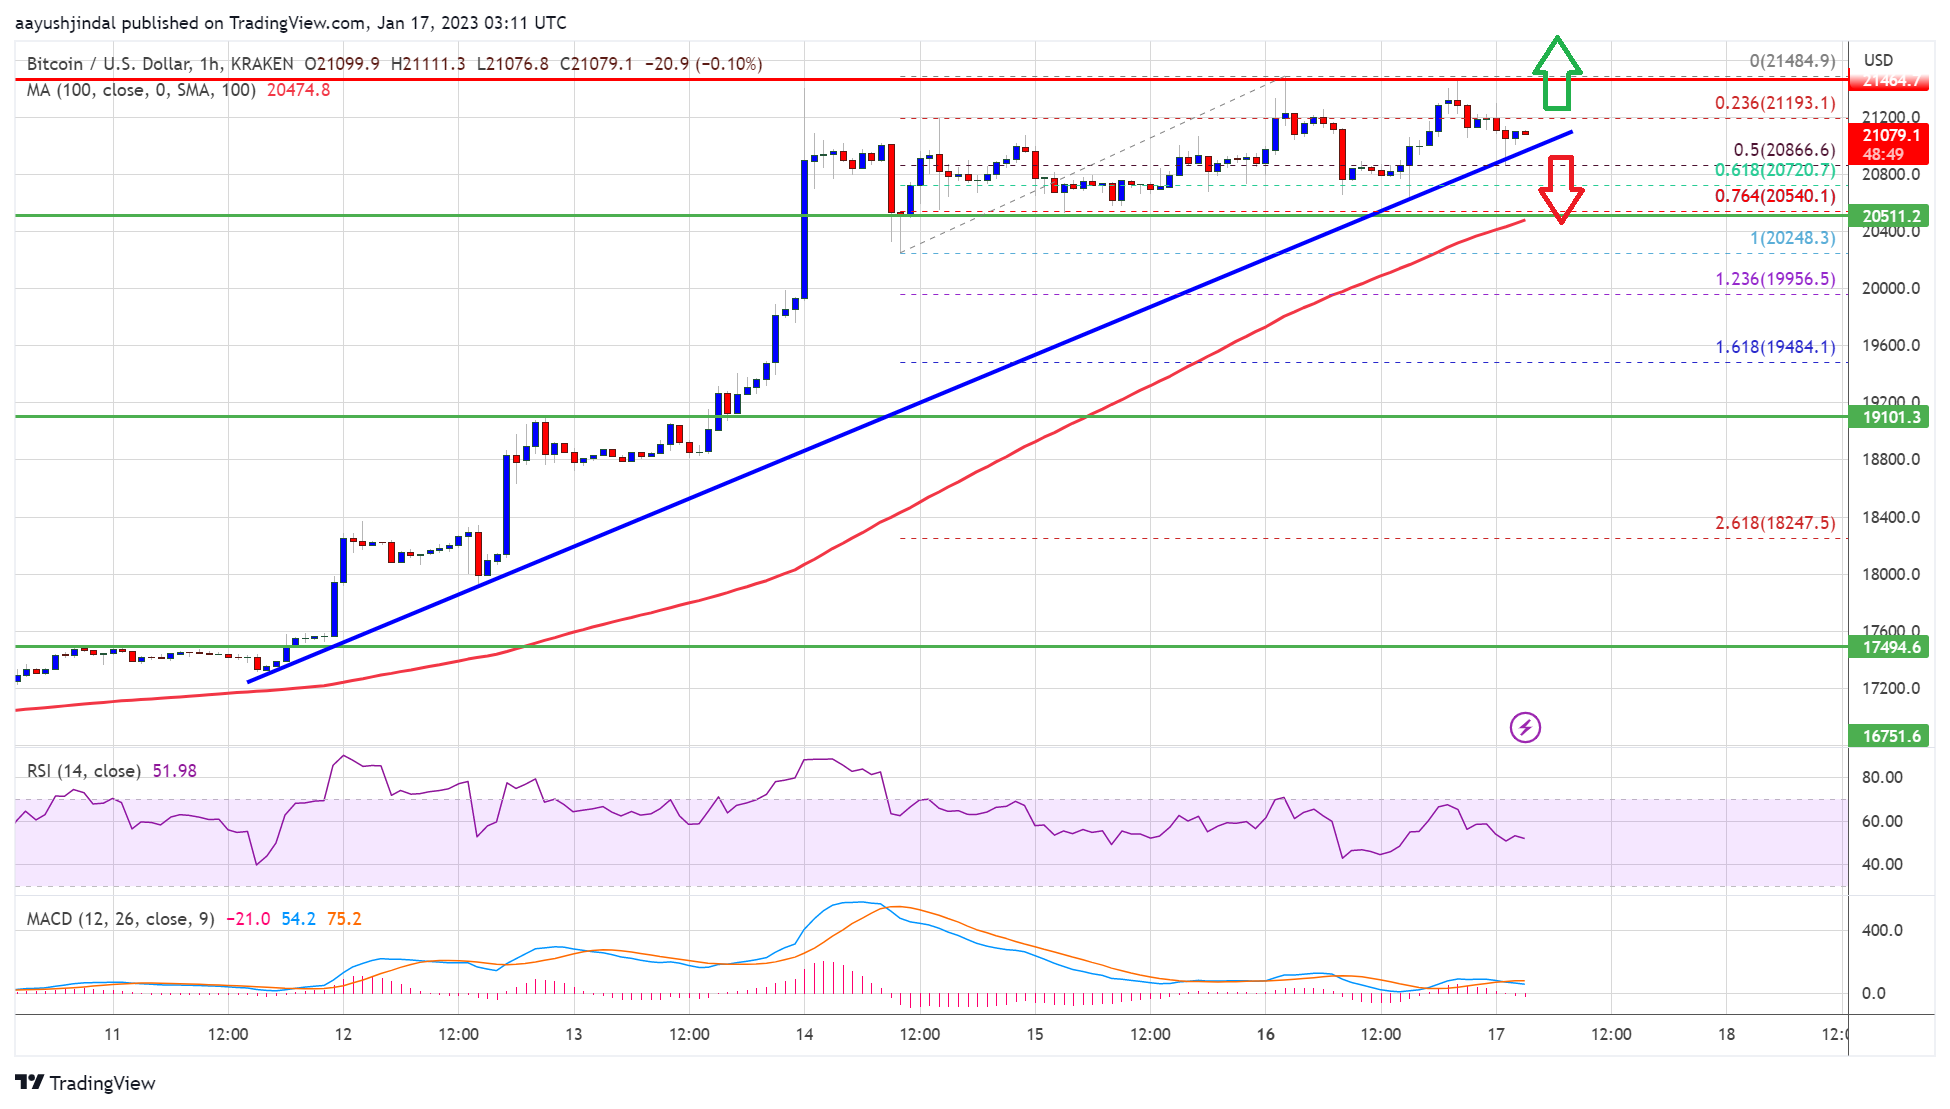
Finally, the price tested the $21,500 resistance zone. A high is formed near $21,485 and the price is now consolidating gains. There was a minor decline below the $21,200 level. The price declined below the 23.6% Fib retracement level of the upward wave from the $20,249 swing low to $21,489 high.
Bitcoin price is now trading above $20,500 and the 100 hourly simple moving average. There is also a key bullish trend line forming with support near $20,920 on the hourly chart of the BTC/USD pair.
Source: BTCUSD on TradingView.com
On the upside, an immediate resistance is near the $21,250 level. The next major resistance is near the $21,500 zone, above which the price might start another steady increase. In the stated case, the price may perhaps rise towards the $22,000 level. Any more gains might send btc price towards the $22,500 level.
If bitcoin price fails to clear the $21,500 resistance, it could slowly move down. An immediate support on the downside is near the $21,000 zone and the trend line.
The next major support is near the $20,720 level. It is near the 61.8% Fib retracement level of the upward wave from the $20,249 swing low to $21,489 high. The main support is now forming near the $20,500 level, below which the price might retest $20,000. Any more losses might send the price to $19,000.
Technical indicators:
Hourly MACD – The MACD is now losing pace in the bullish zone.
Hourly RSI (Relative Strength Index) – The RSI for BTC/USD is now above the 50 level.
Major Support Levels – $20,720, followed by $20,500.
Major Resistance Levels – $21,250, $21,500 and $22,000.
Bitcoin price is facing resistance near the $21,500 zone. BTC could correct lower if there is a clear move below the $20,880 support zone.
Bitcoin seems to be facing a strong resistance near the $21,450 and $21,500 levels.
The price is trading above $20,500 and the 100 hourly simple moving average.
There is a key bullish trend line forming with support near $20,920 on the hourly chart of the BTC/USD pair (data feed from Kraken).
The pair could start a downside correction below the $20,880 and $20,750 support levels.
Bitcoin price started a strong increase above the $20,000 resistance zone. BTC was able to climb above the $20,500 and $21,000 levels to start a major uptrend.
Finally, the price tested the $21,500 resistance zone. A high is formed near $21,485 and the price is now consolidating gains. There was a minor decline below the $21,200 level. The price declined below the 23.6% Fib retracement level of the upward wave from the $20,249 swing low to $21,489 high.
Bitcoin price is now trading above $20,500 and the 100 hourly simple moving average. There is also a key bullish trend line forming with support near $20,920 on the hourly chart of the BTC/USD pair.
Source: BTCUSD on TradingView.com
On the upside, an immediate resistance is near the $21,250 level. The next major resistance is near the $21,500 zone, above which the price might start another steady increase. In the stated case, the price may perhaps rise towards the $22,000 level. Any more gains might send btc price towards the $22,500 level.
If bitcoin price fails to clear the $21,500 resistance, it could slowly move down. An immediate support on the downside is near the $21,000 zone and the trend line.
The next major support is near the $20,720 level. It is near the 61.8% Fib retracement level of the upward wave from the $20,249 swing low to $21,489 high. The main support is now forming near the $20,500 level, below which the price might retest $20,000. Any more losses might send the price to $19,000.
Technical indicators:
Hourly MACD – The MACD is now losing pace in the bullish zone.
Hourly RSI (Relative Strength Index) – The RSI for BTC/USD is now above the 50 level.
Major Support Levels – $20,720, followed by $20,500.
Major Resistance Levels – $21,250, $21,500 and $22,000.
Tags: bitcoinbitcoin pricebtcusdBTCUSDTxbtusd
NewsBTCRead More
The win landed the same week listed miners Riot, MARA, and Genius Group disclosed selling…
Bitcoin Magazine Bitcoin Price Briefly Tops $70,000 as Donald Trump’s Iran Signals Rattle Markets Bitcoin…
Crypto analyst LP has declared that Bitcoin hasn’t seen a true bottoming formation yet, despite…
Bitcoin Magazine Michael Saylor’s Strategy (MSTR) Buys $330 Million in Bitcoin, Holdings Near 767K BTC…
Last week's purchases were mostly funded via sales of the company's STRC preferred stock.Read MoreCoinDesk:…
With Bitcoin trading near $69,000, Strategy is sitting on an unrealized loss on its large…