Bitcoin price is consolidating below the $65,000 resistance zone. BTC must surpass $65,000 and $67,000 to move into a bullish zone again.
Bitcoin is struggling to gain pace for a move above the $65,000 resistance zone.
The price is trading below $65,000 and the 100 hourly Simple moving average.
There was a break above a connecting bearish trend line with resistance at $63,000 on the hourly chart of the BTC/USD pair (data feed from Kraken).
The pair could gain bullish momentum if it clears the $67,000 resistance zone.
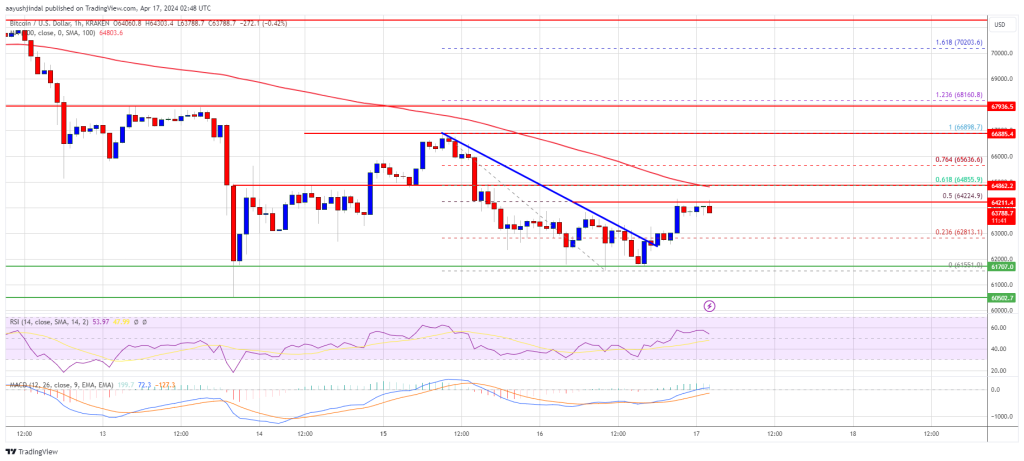
Bitcoin price failed to clear the $67,000 resistance zone. BTC started another decline and traded below the $65,000 support zone. It even declined below $62,000 before the bulls emerged.
A low was formed near $61,551 and the price is now attempting a fresh recovery wave. There was a break above a connecting bearish trend line with resistance at $63,000 on the hourly chart of the BTC/USD pair. The pair climbed above the 23.6% Fib retracement level of the recent decline from the $66,898 swing high to the $61,551 low.
Bitcoin price is trading below $65,000 and the 100 hourly Simple moving average. Immediate resistance is near the $64,250 level. It is close to the 50% Fib retracement level of the recent decline from the $66,898 swing high to the $61,551 low.
The first major resistance could be $64,850. The next resistance now sits at $65,000. If there is a clear move above the $65,000 resistance zone, the price could continue to move up. In the stated case, the price could rise toward $66,500.
Source: BTCUSD on TradingView.com
The next major resistance is near the $67,200 zone. Any more gains might send Bitcoin toward the $70,000 resistance zone in the near term.
If Bitcoin fails to rise above the $65,000 resistance zone, it could start another decline. Immediate support on the downside is near the $62,800 level.
The first major support is $62,000. If there is a close below $62,000, the price could start to drop toward the $61,500 level. Any more losses might send the price toward the $60,500 support zone in the near term.
Technical indicators:
Hourly MACD – The MACD is now losing pace in the bullish zone.
Hourly RSI (Relative Strength Index) – The RSI for BTC/USD is now above the 50 level.
Major Support Levels – $63,000, followed by $62,000.
Major Resistance Levels – $64,850, $65,000, and $67,000.
[#item_full_content]NewsBTCRead MoreResearchers are advancing post-quantum protections even as current hardware remains far from breaking crypto systemsRead…
Bitcoin Magazine Iran to Accept Bitcoin for Strait of Hormuz Transit as Ceasefire Takes Hold…
Bitcoin Magazine Morgan Stanley Becomes Official First US Bank To Launch A Spot Bitcoin ETF…
Claude Mythos Preview identified thousands of zero-day vulnerabilities across every major operating system and browser,…
While BlackRock’s spot bitcoin ETF currently reigns as the liquidity king of crypto, Morgan Stanley’s…
Bitcoin climbed back above $71,000 after news of a conditional U.S.–Iran ceasefire tied to reopening…