Bitcoin price started a decent increase above $68,000. BTC is now consolidating above $66,250 and might aim for more gains above $68,800.
Bitcoin started a fresh increase after it settled above the $67,200 support.
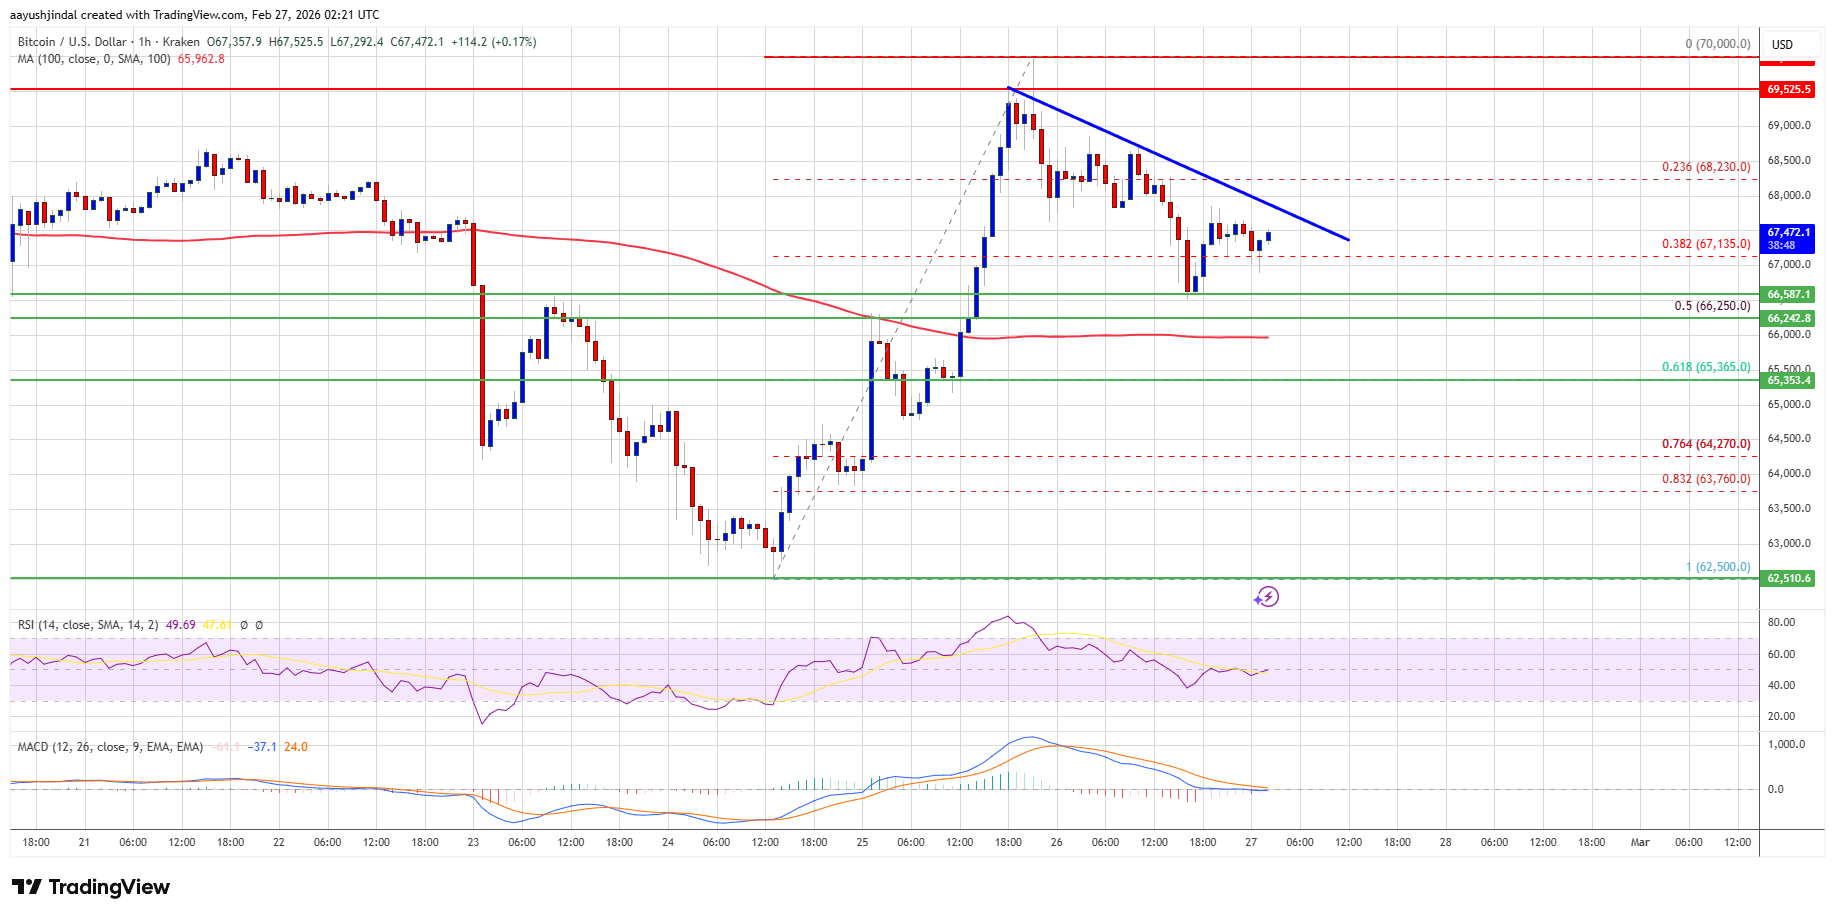
The price is trading above $67,200 and the 100 hourly simple moving average.
There is a new bearish trend line forming with resistance at $68,000 on the hourly chart of the BTC/USD pair (data feed from Kraken).
The pair might dip again if it trades below the $66,500 and $66,250 levels.
Bitcoin price managed to form a base above the $66,500 zone. BTC started a fresh increase and was able to surpass the $68,000 resistance zone.
The price even rallied above the $68,800 resistance. Finally, the bears appeared near $70,000. A high was formed at $70,000, and the price recently corrected some gains. There was a move below the 38.2% Fib retracement level of the upward move from the $62,500 swing low to the $70,000 high.
Bitcoin is now trading above $67,000 and the 100 hourly simple moving average. If the price remains stable above $67,000, it could attempt a fresh increase. Immediate resistance is near the $68,000 level. There is also a new bearish trend line forming with resistance at $68,000 on the hourly chart of the BTC/USD pair.
The first key resistance is near the $68,250 level. A close above the $68,250 resistance might send the price further higher. In the stated case, the price could rise and test the $69,500 resistance. Any more gains might send the price toward the $70,000 level. The next barrier for the bulls could be $70,500 and $71,200.
If Bitcoin fails to rise above the $68,000 resistance zone, it could start another decline. Immediate support is near the $67,000 level. The first major support is near the $66,250 level or the 50% Fib retracement level of the upward move from the $62,500 swing low to the $70,000 high.
The next support is now near the $65,500 zone. Any more losses might send the price toward the $65,000 support in the near term. The main support now sits at $63,500, below which BTC might struggle to recover in the near term.
Technical indicators:
Hourly MACD – The MACD is now losing pace in the bullish zone.
Hourly RSI (Relative Strength Index) – The RSI for BTC/USD is now above the 50 level.
Major Support Levels – $67,000, followed by $66,500.
Major Resistance Levels – $68,000 and $68,500.
[#item_full_content]NewsBTCRead MoreBitcoin spot trading activity has fallen to its weakest level of the year even as…
Bitcoin is now inching towards $70,000, but there is enough to worry about around $64,000.…
The bitcoin miner inked a deal with investment firm Starwood to convert and expand select…
On-chain analytics firm Santiment has highlighted how Ethereum is still undervalued on the MVRV, while…
Bitcoin Magazine Paul Atkins Confirmed As A Bitcoin 2026 Speaker Paul Atkins, the sitting Chairman…
Bitcoin Magazine The Core Issue: libsecp256k1, Bitcoin’s Cryptographic Heart Common phrases heard among Bitcoiners include…