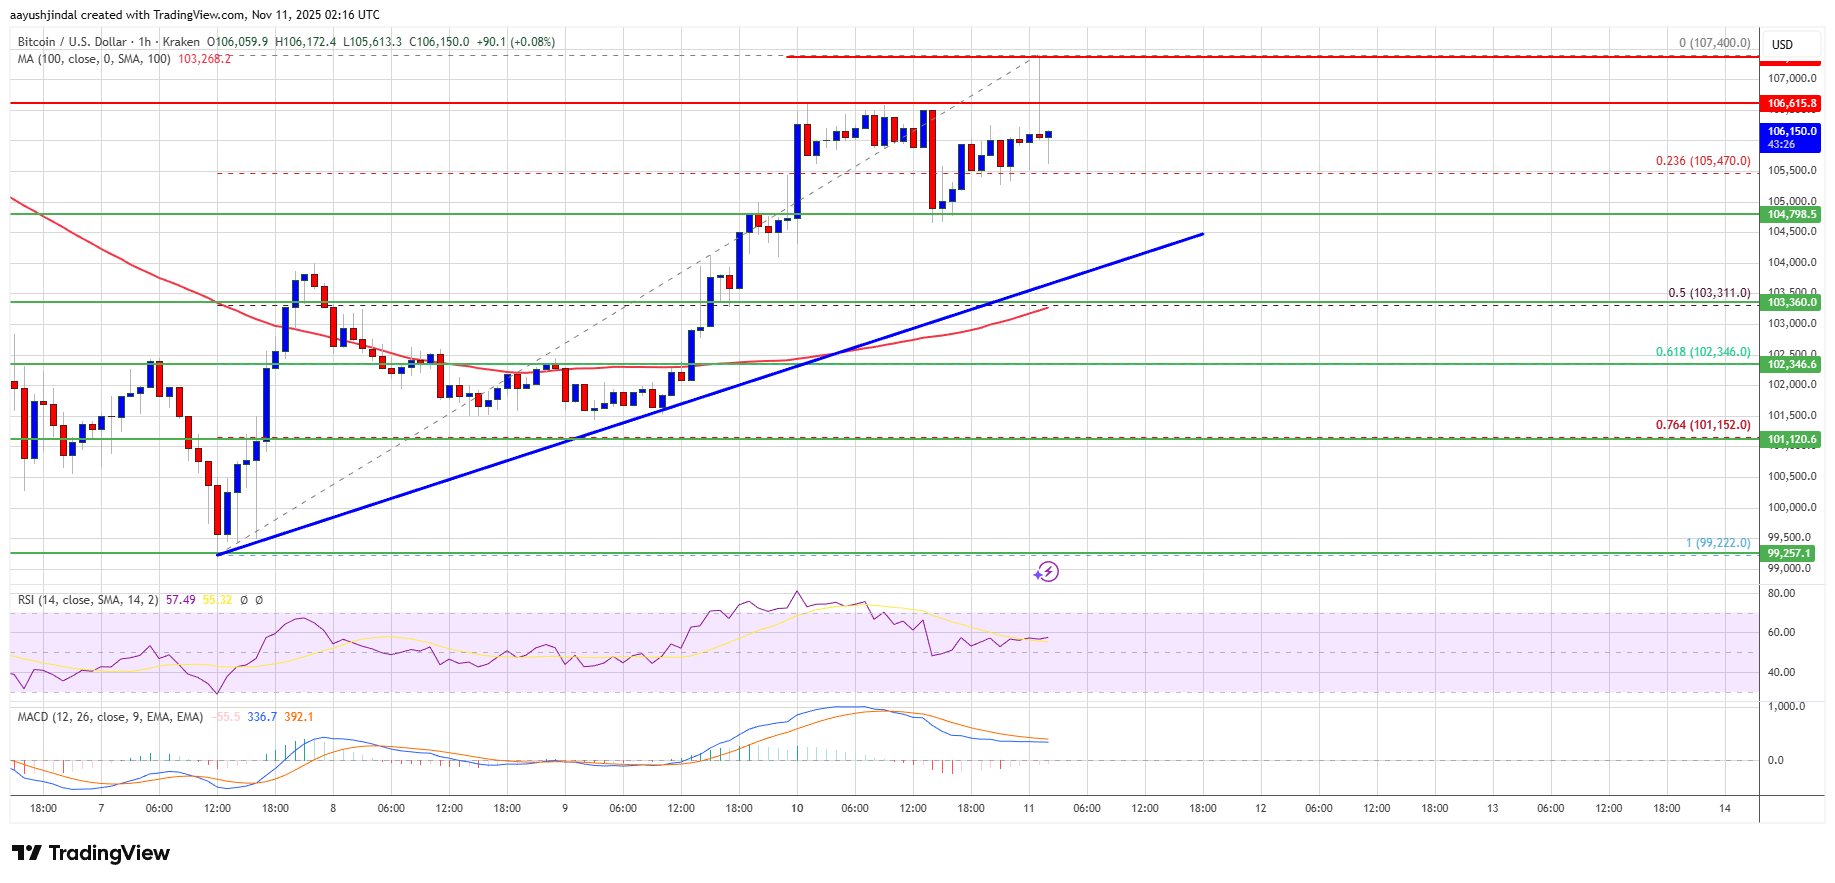
Bitcoin price is attempting to recover above $105,500. BTC could continue to move up if it clears the $107,000 resistance zone.
Bitcoin started a decent recovery wave above the $105,000 support.
The price is trading above $105,000 and the 100 hourly Simple moving average.
There is a bullish trend line forming with support at $104,000 on the hourly chart of the BTC/USD pair (data feed from Kraken).
The pair might continue to move up if it settles above the $107,000 zone.
Bitcoin price managed to stay above the $102,000 support level and started a recovery wave. BTC recovered above the $103,500 and $104,200 resistance levels.
The pair even climbed above $105,500. Finally, it tested the $107,500 resistance zone. A high was formed at $107,400 and the price is now consolidating gains. There was a minor decline below the 23.6% Fib retracement level of the upward move from the $99,222 swing low to the $107,400 high.
Bitcoin is now trading above $105,000 and the 100 hourly Simple moving average. If the bulls attempt another recovery wave, the price could face resistance near the $106,600 level. The first key resistance is near the $107,000 level.
The next resistance could be $107,500. A close above the $107,500 resistance might send the price further higher. In the stated case, the price could rise and test the $108,000 resistance. Any more gains might send the price toward the $109,200 level. The next barrier for the bulls could be $109,800 and $110,500.
If Bitcoin fails to rise above the $107,000 resistance zone, it could start another decline. Immediate support is near the $104,800 level. The first major support is near the $104,000 level and the trend line.
The next support is now near the $103,300 zone or the 50% Fib retracement level of the upward move from the $99,222 swing low to the $107,400 high. Any more losses might send the price toward the $102,350 support in the near term. The main support sits at $102,500, below which BTC might struggle to recover in the near term.
Technical indicators:
Hourly MACD – The MACD is now losing pace in the bullish zone.
Hourly RSI (Relative Strength Index) – The RSI for BTC/USD is now above the 50 level.
Major Support Levels – $104,850, followed by $104,000.
Major Resistance Levels – $106,500 and $107,000.
[#item_full_content]NewsBTCRead MoreLiquidation heatmap shows large liquidity cluster around $66,000, signaling potential downside target.Read MoreCoinDesk: Bitcoin, Ethereum,…
ETFs show institutional demand for bitcoin is cooling after a strong start to the month.Read…
Ukraine’s disruption of Russian oil flows has added fresh uncertainty to already strained energy markets,…
On-chain analytics firm CryptoQuant has pointed out how Bitcoin has tended to revisit or stay…
Every major is red on the day as the war enters its fifth week with…
Bitcoin’s market structure is showing a split signal: institutional demand through ETFs is accelerating, while…