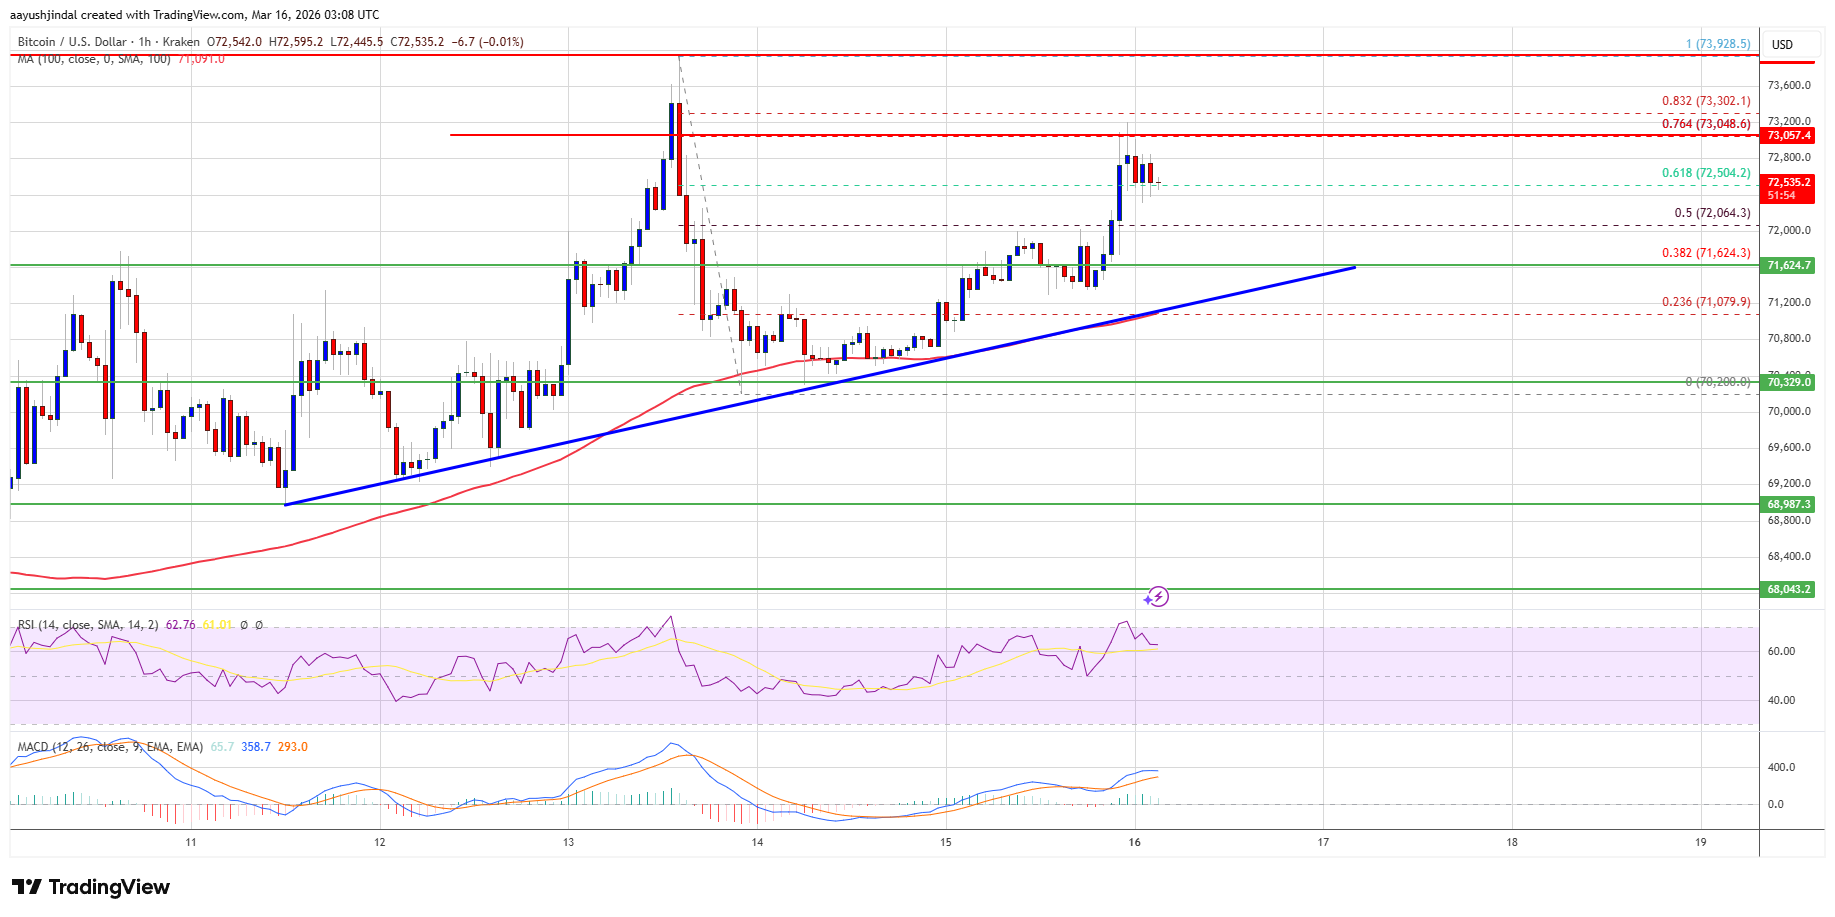
Bitcoin price started a steady increase above the $72,000 zone. BTC is now consolidating and might aim for more gains if it clears $73,000.
Bitcoin started a decent upward move above the $72,000 zone.
The price is trading above $71,200 and the 100 hourly simple moving average.
There is a bullish trend line forming with support at $71,500 on the hourly chart of the BTC/USD pair (data feed from Kraken).
The pair might continue to rise if it clears the $73,000 and $74,000 levels.
Bitcoin price remained elevated and extended its increase above the $70,500 level. BTC climbed above the $71,200 and $72,000 resistance levels.
The bulls were able to pump the price above the 50% Fib retracement level of the downward move from the $73,928 swing high to the $70,200 low. There is also a bullish trend line forming with support at $71,500 on the hourly chart of the BTC/USD pair.
Bitcoin is now trading above $71,800 and the 100 hourly simple moving average. If the price remains stable above $71,500, it could attempt a fresh increase. Immediate resistance is near the $72,800 level. The first key resistance is near the $73,000 level or the 76.4% Fib retracement level of the downward move from the $73,928 swing high to the $70,200 low.
A close above the $73,000 resistance might send the price further higher. In the stated case, the price could rise and test the $73,800 resistance. Any more gains might send the price toward the $74,000 level. The next barrier for the bulls could be $75,000.
If Bitcoin fails to rise above the $73,000 resistance zone, it could start another decline. Immediate support is near the $72,000 level. The first major support is near the $71,500 level or the trend line zone.
The next support is now near the $71,200 zone. Any more losses might send the price toward the $70,350 support in the near term. The main support now sits at $70,000, below which BTC might struggle to recover in the near term.
Technical indicators:
Hourly MACD – The MACD is now gaining pace in the bullish zone.
Hourly RSI (Relative Strength Index) – The RSI for BTC/USD is now above the 50 level.
Major Support Levels – $72,000, followed by $71,500.
Major Resistance Levels – $73,000 and $74,000.
[#item_full_content]NewsBTCRead MoreBitcoin's convincing move above its key average indicates a strengthening of the bullish momentum.Read MoreCoinDesk:…
The crypto market’s fear gauge hit 15 — deep inside “Extreme Fear” territory — yet…
Bitcoin is outperforming equities and gold since the Middle East conflict began, as institutional inflows…
Bitcoin’s recent price action may be showing its first signs of relief as a closely…
Hougan says bitcoin could reach that milestone if it captures a larger share of the…
After another failed attempt at breaking the $74,000 resistance, the Bitcoin price continues to hover…