Bitcoin price started a fresh increase above $95,500. BTC is trading above $96,000 and might soon aim for a move to $100k in the near term.
Bitcoin started a decent increase above $94,000 and $95,500.
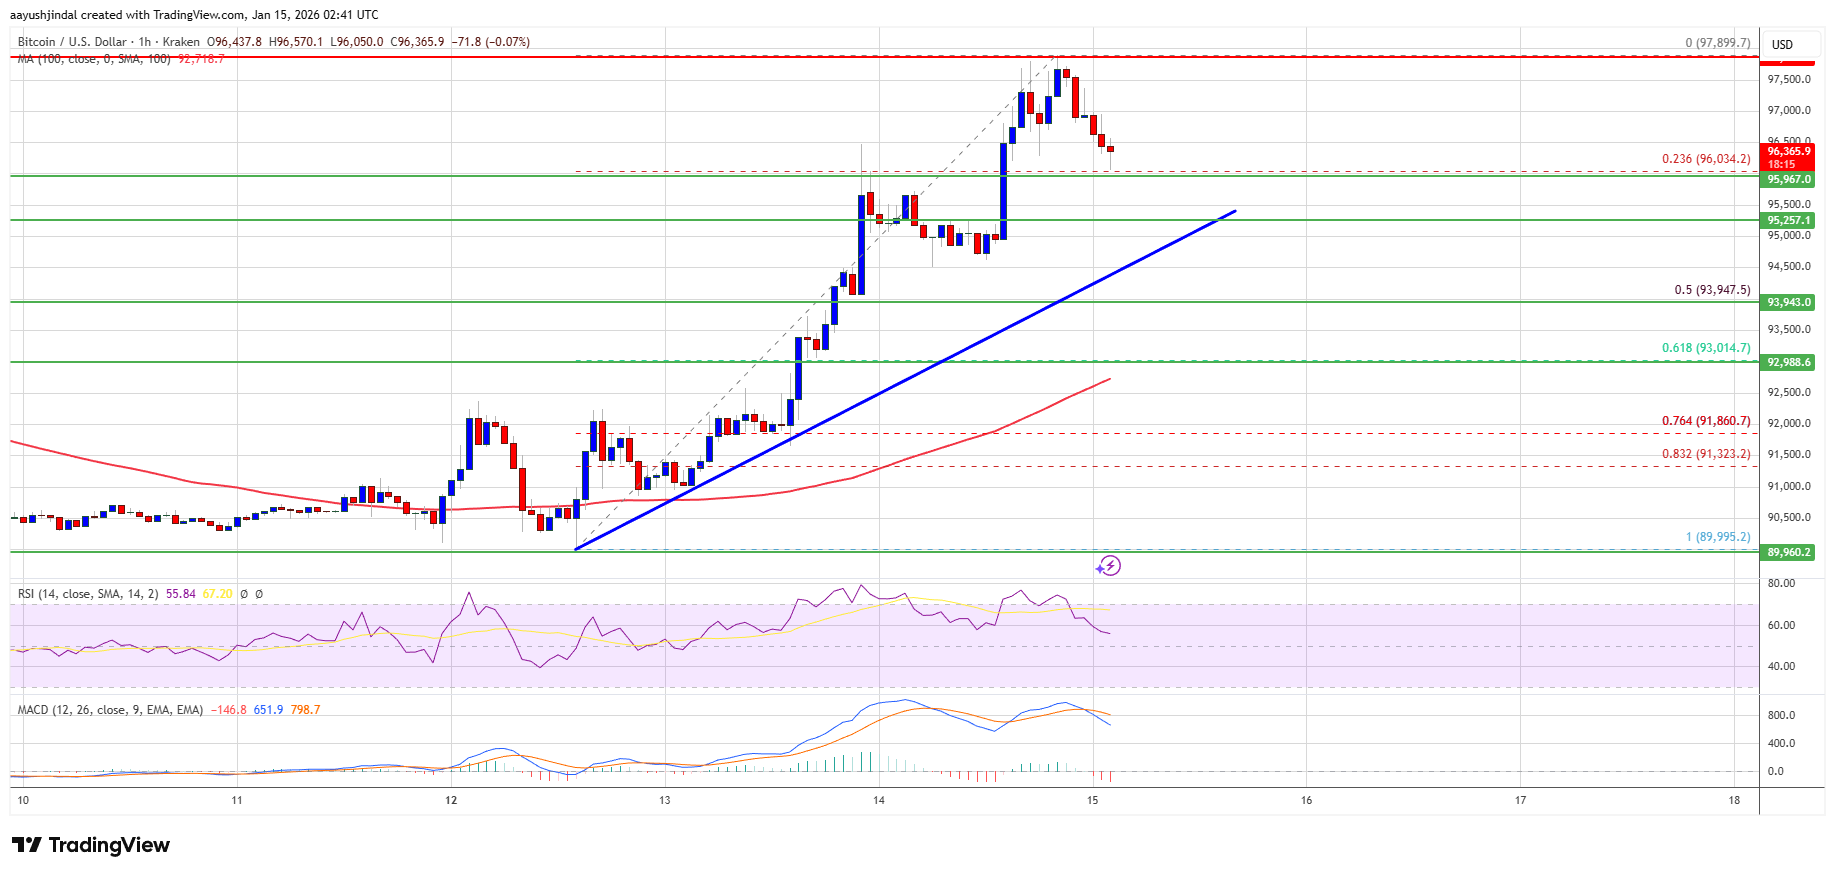
The price is trading above $95,000 and the 100 hourly Simple moving average.
There is a bullish trend line forming with support at $95,250 on the hourly chart of the BTC/USD pair (data feed from Kraken).
The pair might continue to move up if it stays above the $95,000 zone.
Bitcoin price managed to stay above the $92,500 support and started a fresh increase. BTC was able to settle above $94,000 and $95,000.
The bulls were able to push the price above $95,500. Finally, the price spiked above $97,000. A high was formed at $97,898, and the price is now consolidating gains above the 23.6% Fib retracement level of the recent wave from the $89,995 swing low to the $97,898 high.
Bitcoin is now trading above $96,000 and the 100 hourly Simple moving average. If the price remains stable above $95,500, it could attempt a fresh increase. Immediate resistance is near the $97,200 level. The first key resistance is near the $97,800 level.
The next resistance could be $98,000. A close above the $98,000 resistance might send the price further higher. In the stated case, the price could rise and test the $98,800 resistance. Any more gains might send the price toward the $99,500 level. The next barrier for the bulls could be $99,800 and $100,000.
If Bitcoin fails to rise above the $97,200 resistance zone, it could start another decline. Immediate support is near the $96,000 level. The first major support is near the $95,250 level and the trend line.
The next support is now near the $94,000 zone or the 50% Fib retracement level of the recent wave from the $89,995 swing low to the $97,898 high. Any more losses might send the price toward the $93,000 support in the near term. The main support sits at $92,500, below which BTC might accelerate lower in the near term.
Technical indicators:
Hourly MACD – The MACD is now losing pace in the bullish zone.
Hourly RSI (Relative Strength Index) – The RSI for BTC/USD is now above the 50 level.
Major Support Levels – $96,000, followed by $95,250.
Major Resistance Levels – $97,200 and $97,800.
[#item_full_content]NewsBTCRead MoreA potential US military strike on Iran’s main oil export terminal helped push Bitcoin to…
Bitcoin Magazine Bitcoin Price Surges Above $75,000 as Bullish Momentum Builds The bitcoin price climbed…
The alleged theft of 2,323 bitcoin has triggered a High Court dispute testing how English…
Bitcoin Magazine Bitcoin at Key Support Levels — Why Jack Mallers Says Turn On DCA…
Data shows the Bitcoin Fear & Greed Index has marked an improvement after the latest…
Bitcoin Magazine Eric Trump Confirmed As Speaker For Bitcoin 2026 Conference Bitcoin Magazine has confirmed…