Bitcoin price was able to clear the $17,000 resistance. BTC is consolidating gains and might remain supported above the $16,750 level.
Bitcoin gained pace and cleared the $16,800 and $17,000 resistance levels.
The price is trading above $16,800 and the 100 hourly simple moving average.
There is a key bullish trend line forming with support near $16,950 on the hourly chart of the BTC/USD pair (data feed from Kraken).
The pair could rise further if it stays above the $16,500 support zone.
Bitcoin price remained well bid above the $16,500 support zone. BTC gained pace and was able to clear the $16,800 resistance zone plus the 100 hourly simple moving average.
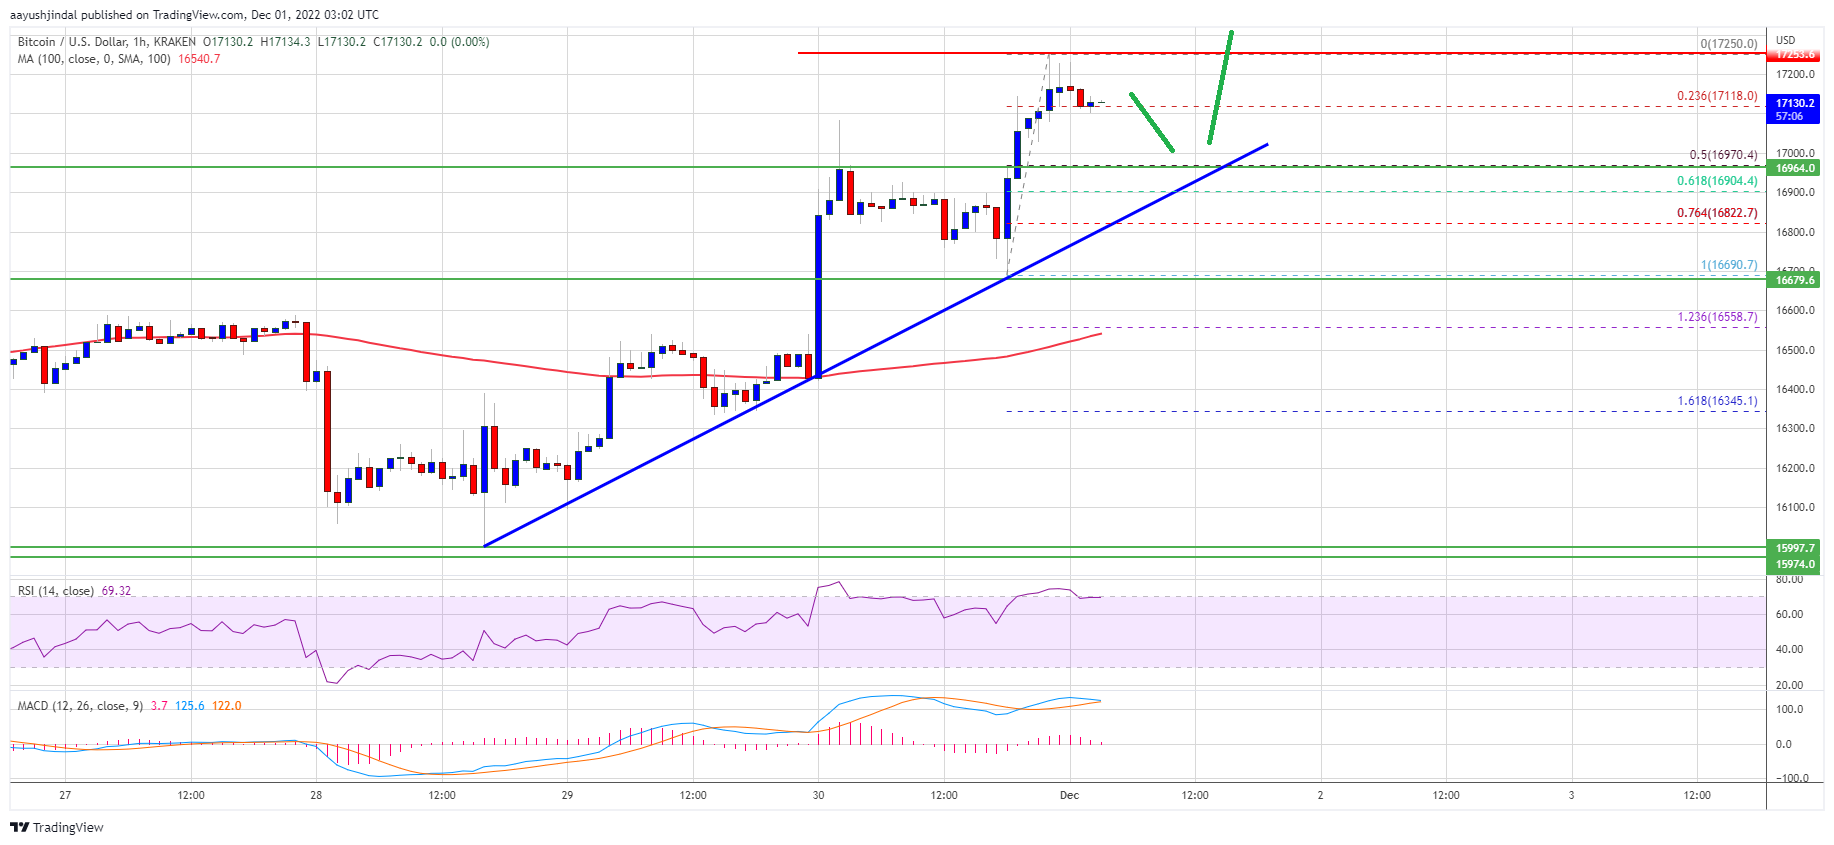
The upward move was such that the price even surpassed the $17,000 resistance zone. It traded as high as $17,250 before the bulls faced sellers. It is now consolidating gains above the $17,000 level. The price is trading near the 23.6% Fib retracement level of the upward move from the $16,690 swing low to $17,250 high.
Bitcoin price is now trading above $16,800 and the 100 hourly simple moving average. There is also a key bullish trend line forming with support near $16,950 on the hourly chart of the BTC/USD pair.
On the upside, an immediate resistance is near the $17,950 level. The first major resistance is near the $17,500 zone, above which the price may perhaps start another steady increase. In the stated case, the price could rise towards the $18,000 resistance.
Source: BTCUSD on TradingView.com
The next major resistance is near $18,800, above which the price could gain pace for a move towards the $19,500 zone in the near term.
If bitcoin fails to climb above the $17,250 resistance, there could be a downside correction. An immediate support on the downside is near the $17,000 level. The next major support is near the $16,950 zone and the trend line.
The trend line is close to the 50% Fib retracement level of the upward move from the $16,690 swing low to $17,250 high. A downside break below the trend line might call for a move towards $16,800. Any more losses might call for a test of the key $16,500 support zone in the near term.
Technical indicators:
Hourly MACD – The MACD is now losing pace in the bullish zone.
Hourly RSI (Relative Strength Index) – The RSI for BTC/USD is now above the 50 level.
Major Support Levels – $16,950, followed by $16,800.
Major Resistance Levels – $17,250, $17,500 and $18,000.
Bitcoin price was able to clear the $17,000 resistance. BTC is consolidating gains and might remain supported above the $16,750 level.
Bitcoin gained pace and cleared the $16,800 and $17,000 resistance levels.
The price is trading above $16,800 and the 100 hourly simple moving average.
There is a key bullish trend line forming with support near $16,950 on the hourly chart of the BTC/USD pair (data feed from Kraken).
The pair could rise further if it stays above the $16,500 support zone.
Bitcoin price remained well bid above the $16,500 support zone. BTC gained pace and was able to clear the $16,800 resistance zone plus the 100 hourly simple moving average.
The upward move was such that the price even surpassed the $17,000 resistance zone. It traded as high as $17,250 before the bulls faced sellers. It is now consolidating gains above the $17,000 level. The price is trading near the 23.6% Fib retracement level of the upward move from the $16,690 swing low to $17,250 high.
Bitcoin price is now trading above $16,800 and the 100 hourly simple moving average. There is also a key bullish trend line forming with support near $16,950 on the hourly chart of the BTC/USD pair.
On the upside, an immediate resistance is near the $17,950 level. The first major resistance is near the $17,500 zone, above which the price may perhaps start another steady increase. In the stated case, the price could rise towards the $18,000 resistance.
Source: BTCUSD on TradingView.com
The next major resistance is near $18,800, above which the price could gain pace for a move towards the $19,500 zone in the near term.
If bitcoin fails to climb above the $17,250 resistance, there could be a downside correction. An immediate support on the downside is near the $17,000 level. The next major support is near the $16,950 zone and the trend line.
The trend line is close to the 50% Fib retracement level of the upward move from the $16,690 swing low to $17,250 high. A downside break below the trend line might call for a move towards $16,800. Any more losses might call for a test of the key $16,500 support zone in the near term.
Technical indicators:
Hourly MACD – The MACD is now losing pace in the bullish zone.
Hourly RSI (Relative Strength Index) – The RSI for BTC/USD is now above the 50 level.
Major Support Levels – $16,950, followed by $16,800.
Major Resistance Levels – $17,250, $17,500 and $18,000.
Tags: bitcoinbitcoin pricebtcusdBTCUSDTxbtusd
NewsBTCRead More
Bitcoin Magazine David Bailey Confirmed As A Bitcoin 2026 Speaker David Bailey has been officially…
Bitcoin Magazine Paraguay Adopts Stricter Crypto Oversight, Mandates Detailed Transaction on Bitcoin Reporting Paraguay’s National…
Bitcoin Magazine Policy Group Calls for Bitcoin Inclusion in Proposed Crypto Tax Exemption The Bitcoin…
Bitcoin Magazine Corporate Bitcoin Holdings Hit Record High as Institutions Accumulate 2.8x Mining Supply: Report…
Research shows that only 8% to 10% of global Bitcoin hashrate runs in oil-sensitive power…
Today’s quantum computers are far from breaking Bitcoin’s cryptography and any real threat would likely…