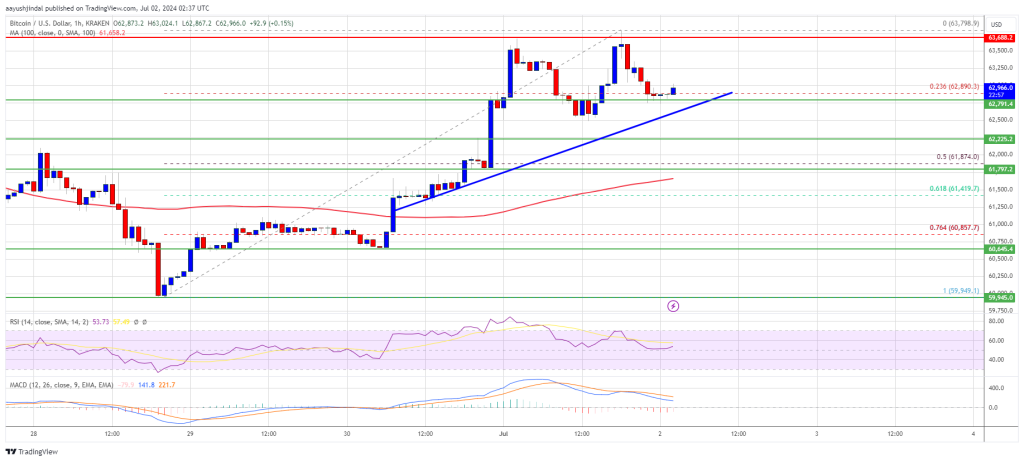
Bitcoin price recovered and tested the $63,650 resistance zone. BTC is now consolidating gains and might make another attempt to surpass $63,650.
Bitcoin started a decent increase above the $62,500 and $63,000 levels.
The price is trading above $62,250 and the 100 hourly Simple moving average.
There is a connecting bullish trend line forming with support at $62,800 on the hourly chart of the BTC/USD pair (data feed from Kraken).
The pair might gain bullish momentum if it clears the $63,650 resistance zone.
Bitcoin price started a decent upward move above the $61,200 zone. BTC was able to clear the $62,000 and $63,000 resistance levels to move into a short-term positive zone.
However, the bears took a stand near the $63,650 zone. A high was formed at $63,798 and the price recently corrected some gains. There was a move below the $63,200 level. The price tested the 23.6% Fib retracement level of the upward move from the $59,950 swing low to the $63,798 high.
Bitcoin price is now trading above $62,250 and the 100 hourly Simple moving average. There is also a connecting bullish trend line forming with support at $62,800 on the hourly chart of the BTC/USD pair.
If there is another increase, the price could face resistance near the $63,250 level. The first key resistance is near the $63,650 level. The next key resistance could be $64,000. A clear move above the $64,000 resistance might start a steady increase and send the price higher.
In the stated case, the price could rise and test the $65,000 resistance. Any more gains might send BTC toward the $66,500 resistance in the near term.
If Bitcoin fails to climb above the $63,650 resistance zone, it could slowly move down. Immediate support on the downside is near the $62,800 level and the trend line.
The first major support is $62,200. The next support is now forming near $61,800 and the 100 hourly Simple moving average. It is close to the 50% Fib retracement level of the upward move from the $59,950 swing low to the $63,798 high. Any more losses might send the price toward the $60,500 support zone in the near term.
Technical indicators:
Hourly MACD – The MACD is now losing pace in the bullish zone.
Hourly RSI (Relative Strength Index) – The RSI for BTC/USD is now above the 50 level.
Major Support Levels – $62,800, followed by $61,800.
Major Resistance Levels – $63,650, and $64,000.
[#item_full_content]NewsBTCRead MoreBitcoin is down just 1.5% in its historically weakest month and remains on track for…
Bitcoin recovered from $75,972 overnight to just below $78,000, a third straight day of gains.Read…
The U.S. Treasury sanctioned BitBank, a Tehran exchange it says moved hundreds of millions of…
Corporate treasuries bought just 5,900 bitcoin in three months, while broader demand signals remain weak.Read…
Ether funds shed money for a third straight session even as the token rose, while…
The yen declined and BTC rose after the BOJ hiked rates to the highest level…