Bitcoin price is attempting a fresh increase above the $21,200 resistance zone. BTC could gain bullish momentum if there is a clear move above the $21,500 resistance.
Bitcoin corrected lower, but it found support near the $20,500 zones.
The price is trading above $21,000 and the 100 hourly simple moving average.
There is a short-term key bullish trend line forming with support near $21,050 on the hourly chart of the BTC/USD pair (data feed from Kraken).
The pair could start a fresh increase if there is a clear move above the $21,500 resistance zone.
Bitcoin price started a downside correction from the $21,500 resistance zone. BTC declined below the $21,000 support zone, similar to ethereum.
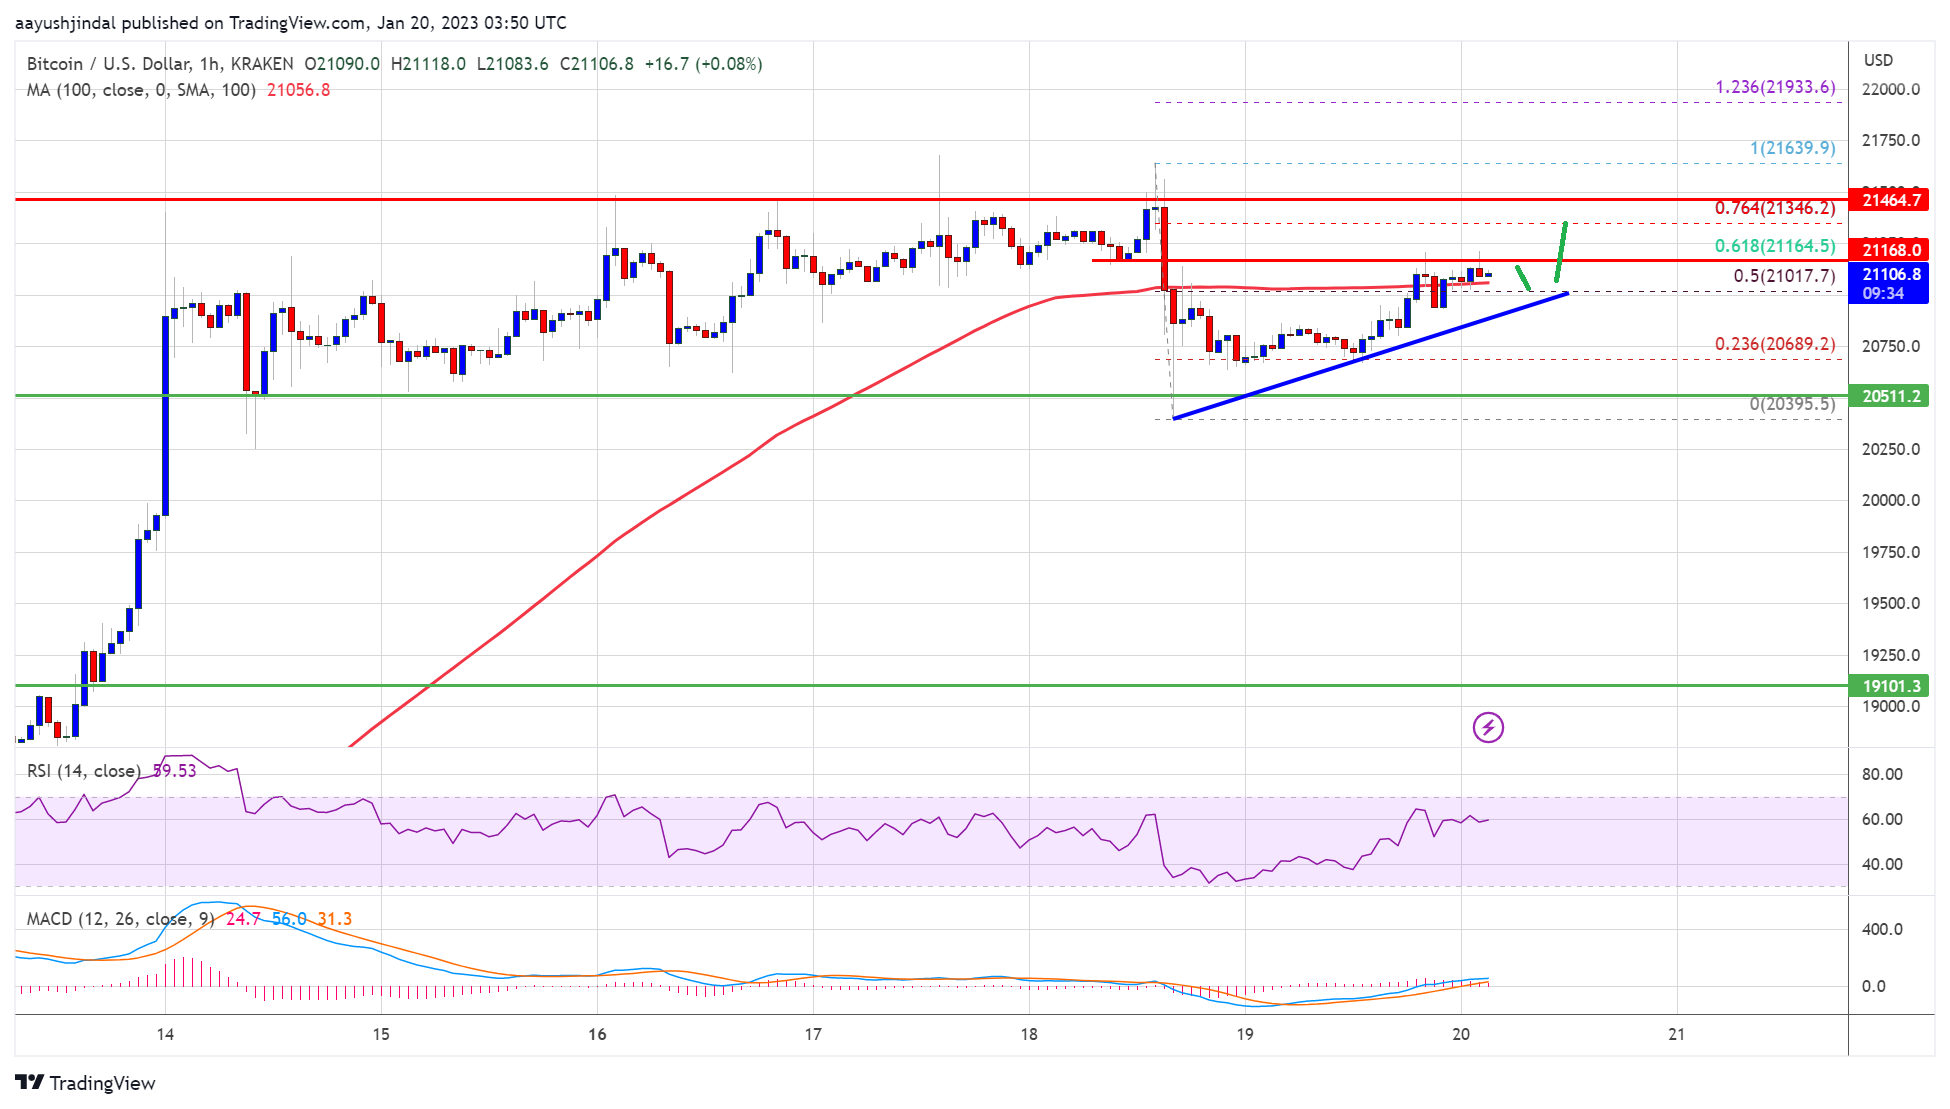
However, the bulls were active near the $20,500 and $20,400 support levels. A low is formed near $20,395 and the price is now rising. There was a clear move above the $20,850 resistance zone. The bulls pushed the price above the 50% Fib retracement level of the recent decline from the $21,639 swing high to $20,395 low.
Bitcoin price is now trading above $21,000 and the 100 hourly simple moving average. There is also a short-term key bullish trend line forming with support near $21,050 on the hourly chart of the BTC/USD pair.
An immediate resistance is near the $21,160 level. It is near the 61.8% Fib retracement level of the recent decline from the $21,639 swing high to $20,395. The next major resistance is near the $21,500 zone, above which the price might gain bullish momentum.
Source: BTCUSD on TradingView.com
In the stated case, the price may perhaps rise towards the $22,000 level. Any more gains might send btc price towards the $22,500 level.
If bitcoin price fails to clear the $21,250 resistance, it could start a fresh decline. An immediate support on the downside is near the $21,050 zone and the trend line.
The next major support is near the $20,500 zone, below which the price might gain bearish momentum and test $20,000. Any more losses might send the price to $19,500 in the near term.
Technical indicators:
Hourly MACD – The MACD is now losing pace in the bearish zone.
Hourly RSI (Relative Strength Index) – The RSI for BTC/USD is now above the 50 level.
Major Support Levels – $20,500, followed by $20,000.
Major Resistance Levels – $21,160, $21,250 and $21,500.
Bitcoin price is attempting a fresh increase above the $21,200 resistance zone. BTC could gain bullish momentum if there is a clear move above the $21,500 resistance.
Bitcoin corrected lower, but it found support near the $20,500 zones.
The price is trading above $21,000 and the 100 hourly simple moving average.
There is a short-term key bullish trend line forming with support near $21,050 on the hourly chart of the BTC/USD pair (data feed from Kraken).
The pair could start a fresh increase if there is a clear move above the $21,500 resistance zone.
Bitcoin price started a downside correction from the $21,500 resistance zone. BTC declined below the $21,000 support zone, similar to ethereum.
However, the bulls were active near the $20,500 and $20,400 support levels. A low is formed near $20,395 and the price is now rising. There was a clear move above the $20,850 resistance zone. The bulls pushed the price above the 50% Fib retracement level of the recent decline from the $21,639 swing high to $20,395 low.
Bitcoin price is now trading above $21,000 and the 100 hourly simple moving average. There is also a short-term key bullish trend line forming with support near $21,050 on the hourly chart of the BTC/USD pair.
An immediate resistance is near the $21,160 level. It is near the 61.8% Fib retracement level of the recent decline from the $21,639 swing high to $20,395. The next major resistance is near the $21,500 zone, above which the price might gain bullish momentum.
Source: BTCUSD on TradingView.com
In the stated case, the price may perhaps rise towards the $22,000 level. Any more gains might send btc price towards the $22,500 level.
If bitcoin price fails to clear the $21,250 resistance, it could start a fresh decline. An immediate support on the downside is near the $21,050 zone and the trend line.
The next major support is near the $20,500 zone, below which the price might gain bearish momentum and test $20,000. Any more losses might send the price to $19,500 in the near term.
Technical indicators:
Hourly MACD – The MACD is now losing pace in the bearish zone.
Hourly RSI (Relative Strength Index) – The RSI for BTC/USD is now above the 50 level.
Major Support Levels – $20,500, followed by $20,000.
Major Resistance Levels – $21,160, $21,250 and $21,500.
Tags: bitcoinbitcoin pricebtcusdBTCUSDTxbtusd
NewsBTCRead More
Lekker Capital CIO Quinn Thompson argues on X that collapsing mining economics, combined with a…
A Cambridge study spanning 11 years and 68 verified cable failures found that Bitcoin's physical…
On-chain analytics firm Glassnode has explained how a flip in Bitcoin short-term holder profitability could…
A crypto analyst is calling for a $40,000 Bitcoin price surge within 60 days, and…
As Bitcoin (BTC) seeks to solidify its position around $71,000, the cryptocurrency faces a challenge…
Bitcoin and crypto exchanges built much of the cryptocurrency industry’s reputation by challenging traditional finance.…