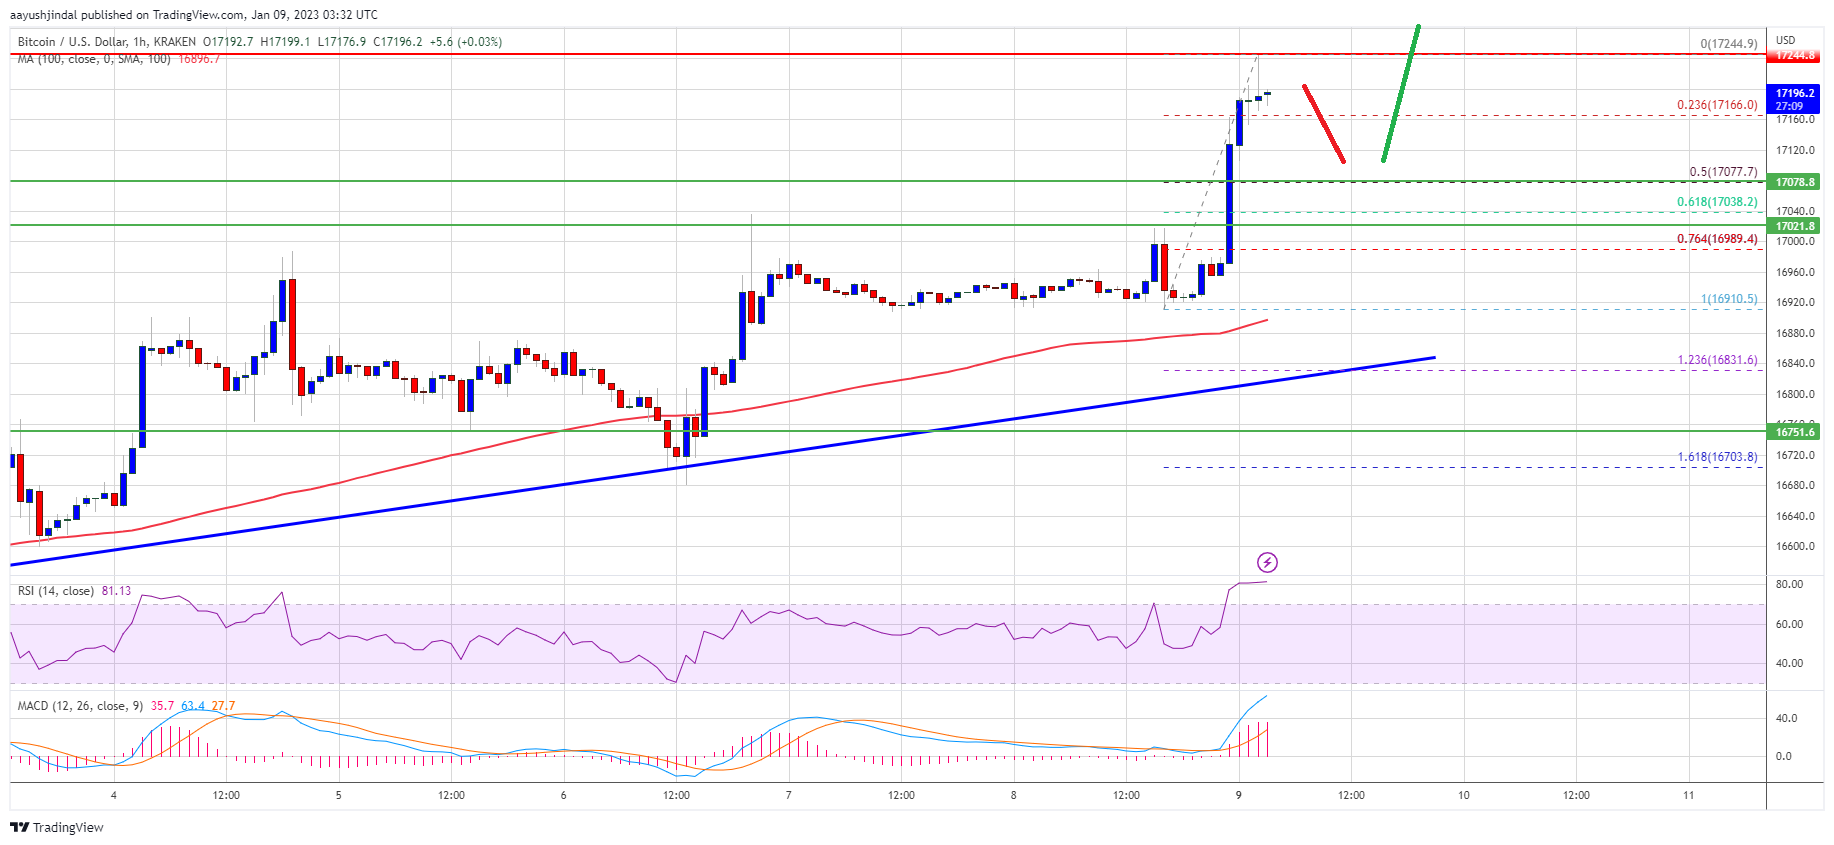
Bitcoin price gained pace and cleared the $17,000 resistance. BTC is showing positive signs and might rise towards the $18,000 resistance.
Bitcoin started a fresh increase above the $16,800 and $17,000 resistance levels.
The price is trading above $16,800 and the 100 hourly simple moving average.
There is a major bullish trend line forming with support near $16,800 on the hourly chart of the BTC/USD pair (data feed from Kraken).
The pair could rise further towards the next hurdle near the $18,000 resistance.
Bitcoin price formed a support base above the $16,650 level. BTC remained well bid and started a fresh increase above the $16,800 and $17,000 resistance levels.
There was a close above the $17,000 level and the 100 hourly simple moving average. The price traded to a new yearly high at $17,244 and broke a major barrier. It is now consolidating gains above the $17,000 level. It is also trading above the 23.6% Fib retracement level of the upward move from the $16,910 swing low to $17,244 high.
Bitcoin price is now trading above $16,800 and the 100 hourly simple moving average. There is also a major bullish trend line forming with support near $16,800 on the hourly chart of the BTC/USD pair.
Source: BTCUSD on TradingView.com
On the upside, an immediate resistance is near the $17,250 level. The next major resistance is near the $17,500 zone. A clear move and close above the $17,500 resistance might start another rally in the near term. In the stated case, the price may perhaps rise towards the $18,000 level. Any more gains might call for a move towards the $18,500 level.
If bitcoin price fails to clear the $17,250 resistance, it could start a downside correction. An immediate support on the downside is near the $17,150 level.
The next major support is near the $17,000 level. It is near the 50% Fib retracement level of the upward move from the $16,910 swing low to $17,244 high. The main support is now forming near the $17,000 zone, below which the price might retest $16,800.
Technical indicators:
Hourly MACD – The MACD is now gaining pace in the bullish zone.
Hourly RSI (Relative Strength Index) – The RSI for BTC/USD is now above the 50 level.
Major Support Levels – $17,150, followed by $17,000.
Major Resistance Levels – $17,250, $17,500 and $18,000.
Tags: bitcoinbitcoin pricebtcusdBTCUSDTxbtusd
NewsBTCRead More
On-chain data shows the large Bitcoin holders have been participating in a notable amount of…
Google's quantum paper made headlines with that number. Here's what it means, what's actually at…
Ethereum could outpace Bitcoin by a wide margin over the next four years — at…
Bitcoin is often celebrated as a decentralized network, with mining power distributed globally to ensure…
Bitcoin (BTC) faces a stark downside risk that could send prices below the previous bear…
Crypto analyst Jordan has predicted that the Bitcoin price could rally to $80,000 in the…