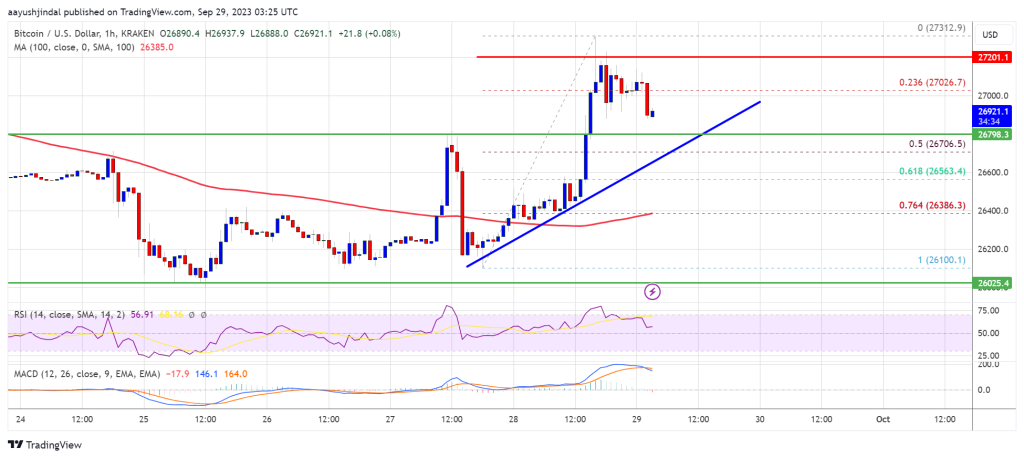
Bitcoin price is gaining pace above the $26,700 resistance. BTC is consolidating above $26,800 and might continue to rise above the $27,200 resistance.
Bitcoin gained pace above the $26,500 and $26,700 resistance levels.
The price is trading above $26,700 and the 100 hourly Simple moving average.
There is a key bullish trend line forming with support near $26,800 on the hourly chart of the BTC/USD pair (data feed from Kraken).
The pair could accelerate higher above the $27,200 resistance zone.
Bitcoin price remained stable above the $26,000 support zone. BTC formed a base and started a steady increase above the $26,500 resistance zone.
The bulls finally managed to pump the price above the $26,700 resistance. It even spiked above the $27,200 level. A high is formed near $27,312 and the price is now consolidating gains. There was a minor decline below the 23.6% Fib retracement level of the upward move from the $26,100 swing low to the $27,312 high.
Bitcoin is trading above $26,700 and the 100 hourly Simple moving average. There is also a key bullish trend line forming with support near $26,800 on the hourly chart of the BTC/USD pair.
Source: BTCUSD on TradingView.com
Immediate resistance on the upside is near the $27,200 level. The next key resistance could be near the $27,500 level. A close above the $27,500 resistance could send the price further higher. In the stated case, the price could climb toward the $28,200 resistance. Any more gains might call for a move toward the $28,500 level.
If Bitcoin fails to continue higher above the $27,200 resistance, there could be a downside correction. Immediate support on the downside is near the $26,800 level and the trend line.
The next major support is near the $26,500 level or the 50% Fib retracement level of the upward move from the $26,100 swing low to the $27,312 high. A downside break and close below the $26,500 level might start another major decline. The next support sits at $26,000. Any more losses might call for a test of $25,400.
Technical indicators:
Hourly MACD – The MACD is now losing pace in the bullish zone.
Hourly RSI (Relative Strength Index) – The RSI for BTC/USD is now above the 50 level.
Major Support Levels – $26,800, followed by $26,500.
Major Resistance Levels – $27,200, $27,500, and $28,000.
[#item_full_content]NewsBTCRead MoreFed chair Jerome Powell said rising energy prices are feeding into the inflation outlook, but…
Bitcoin is starting to show intriguing signals on the monthly time frame, with long-term data…
Bitcoin Magazine Bitcoin Price Fights For $70,000 As Federal Reserve Holds Rates The Federal Reserve…
Bitcoin Magazine Till Death or Seed Phrase: Woman Accused of Spying on Husband, Stealing $172…
Bitcoin (BTC) is hanging around $74k, still respecting the post‑shock range and struggling to clear…
A falling hash rate and the resultant pressure on miners could signal another potential capitulation…