Bitcoin price failed to stay above $70,500 and declined further. BTC is now consolidating below $70,500 and might continue to move down.
Bitcoin started a fresh decline from well above the $71,200 zone.
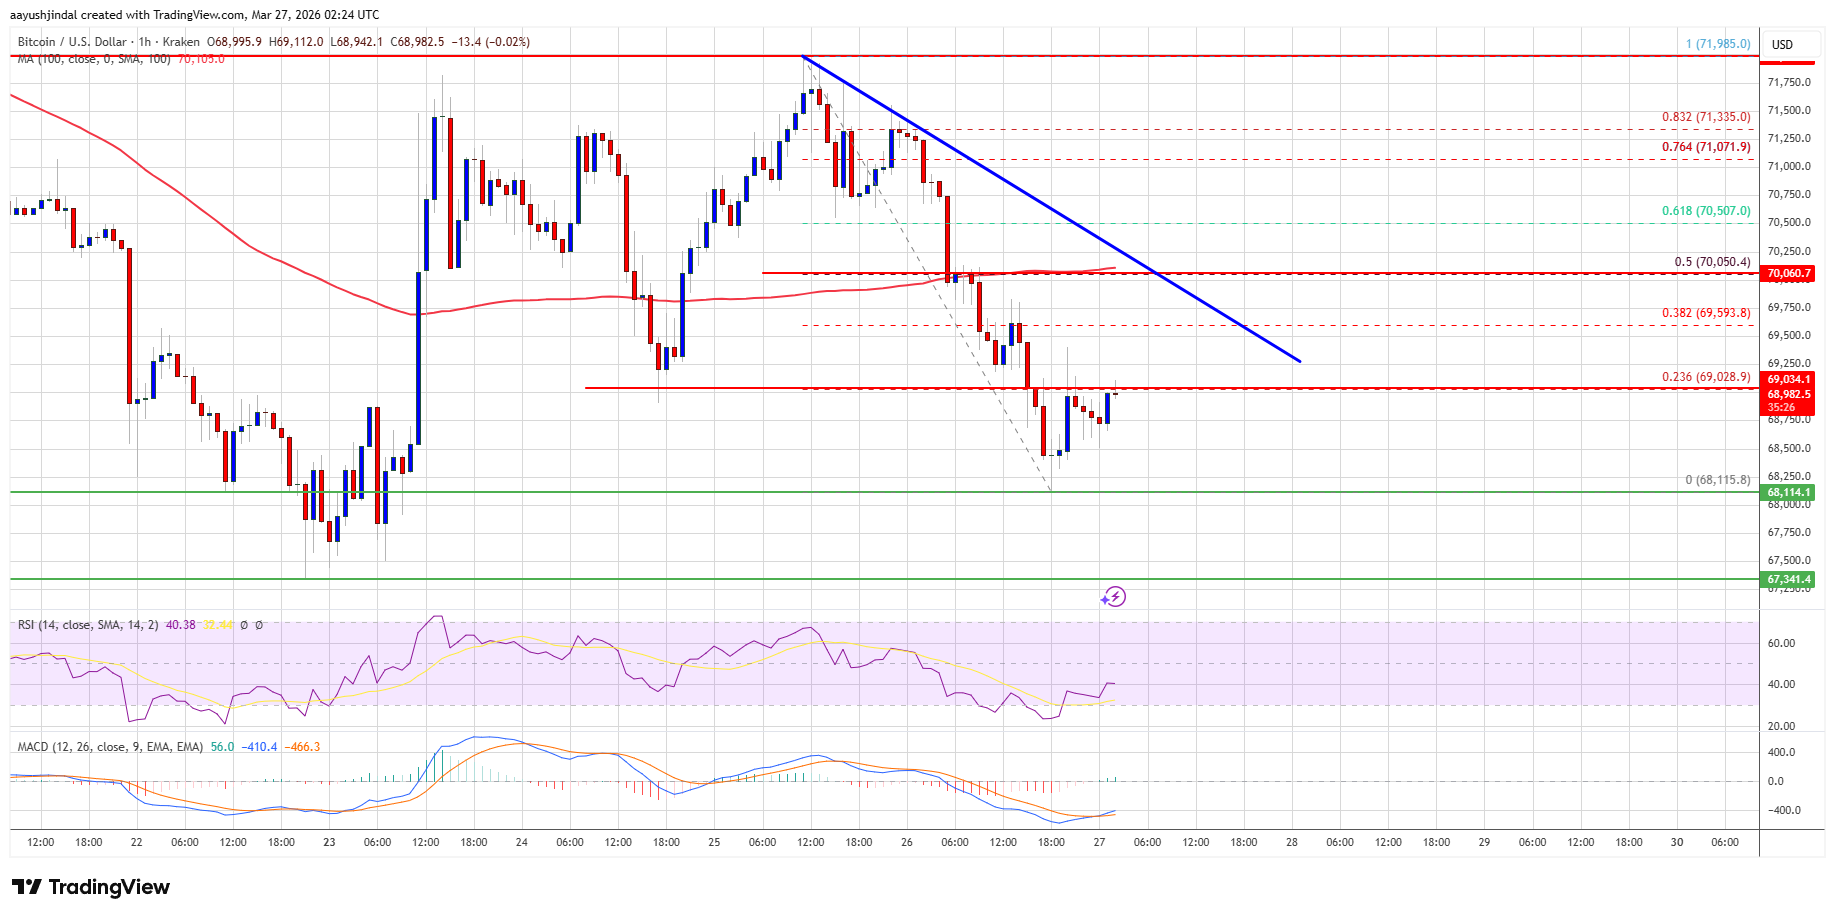
The price is trading below $70,500 and the 100 hourly simple moving average.
There is a bearish trend line forming with resistance at $70,050 on the hourly chart of the BTC/USD pair (data feed from Kraken).
The pair might start another decline if it stays below the $70,000 and $70,500 levels.
Bitcoin price failed to continue higher above $72,000 and reacted to the downside. BTC trimmed gains and declined below the $71,200 support.
The bears pushed the price below $70,500 and $70,000. The price tested the $68,000 zone. A low was formed at $68,115, and the price is now consolidating losses near the 23.6% Fib retracement level of the downward move from the $71,985 swing high to the $68,115 low.
Bitcoin is now trading below $70,200 and the 100 hourly simple moving average. There is also a bearish trend line forming with resistance at $70,050 on the hourly chart of the BTC/USD pair.
If the price remains stable above $68,200, it could attempt a fresh increase. Immediate resistance is near the $69,200 level. The first key resistance is near the $70,000 level and the trend line. A close above the $70,000 resistance might send the price further higher.
In the stated case, the price could rise and test the $70,500 resistance or the 61.8% Fib retracement level of the downward move from the $71,985 swing high to the $68,115 low. Any more gains might send the price toward the $71,200 level. The next barrier for the bulls could be $72,000.
If Bitcoin fails to rise above the $70,000 resistance zone, it could start another decline. Immediate support is near the $68,400 level. The first major support is near the $68,000 level.
The next support is now near the $67,200 zone. Any more losses might send the price toward the $66,800 support in the near term. The main support now sits at $65,500, below which BTC might struggle to recover in the near term.
Technical indicators:
Hourly MACD – The MACD is now losing pace in the bearish zone.
Hourly RSI (Relative Strength Index) – The RSI for BTC/USD is now below the 50 level.
Major Support Levels – $68,400, followed by $68,000.
Major Resistance Levels – $70,000 and $70,500.
[#item_full_content]NewsBTCRead MoreEvery major is red on the day as the war enters its fifth week with…
Bitcoin’s market structure is showing a split signal: institutional demand through ETFs is accelerating, while…
A market analyst has released a new XRP price analysis, using the Bitcoin (BTC) chart…
The video retailer sparked speculations of selling bitcoin after it transferred nearly all its coins…
Bitcoin Magazine St. Cloud Financial Credit Union Surpasses 10 Bitcoin in Member Custody Pilot St.…
Bitcoin Magazine Simon Gerovich Confirmed As A Bitcoin 2026 Speaker Simon Gerovich has been officially…