Bitcoin price is slowly moving higher above the $86,500 zone. BTC is gaining pace and might continue higher in the near term.
Bitcoin found support at $84,200 and started a recovery wave.
The price is trading above $85,500 and the 100 hourly Simple moving average.
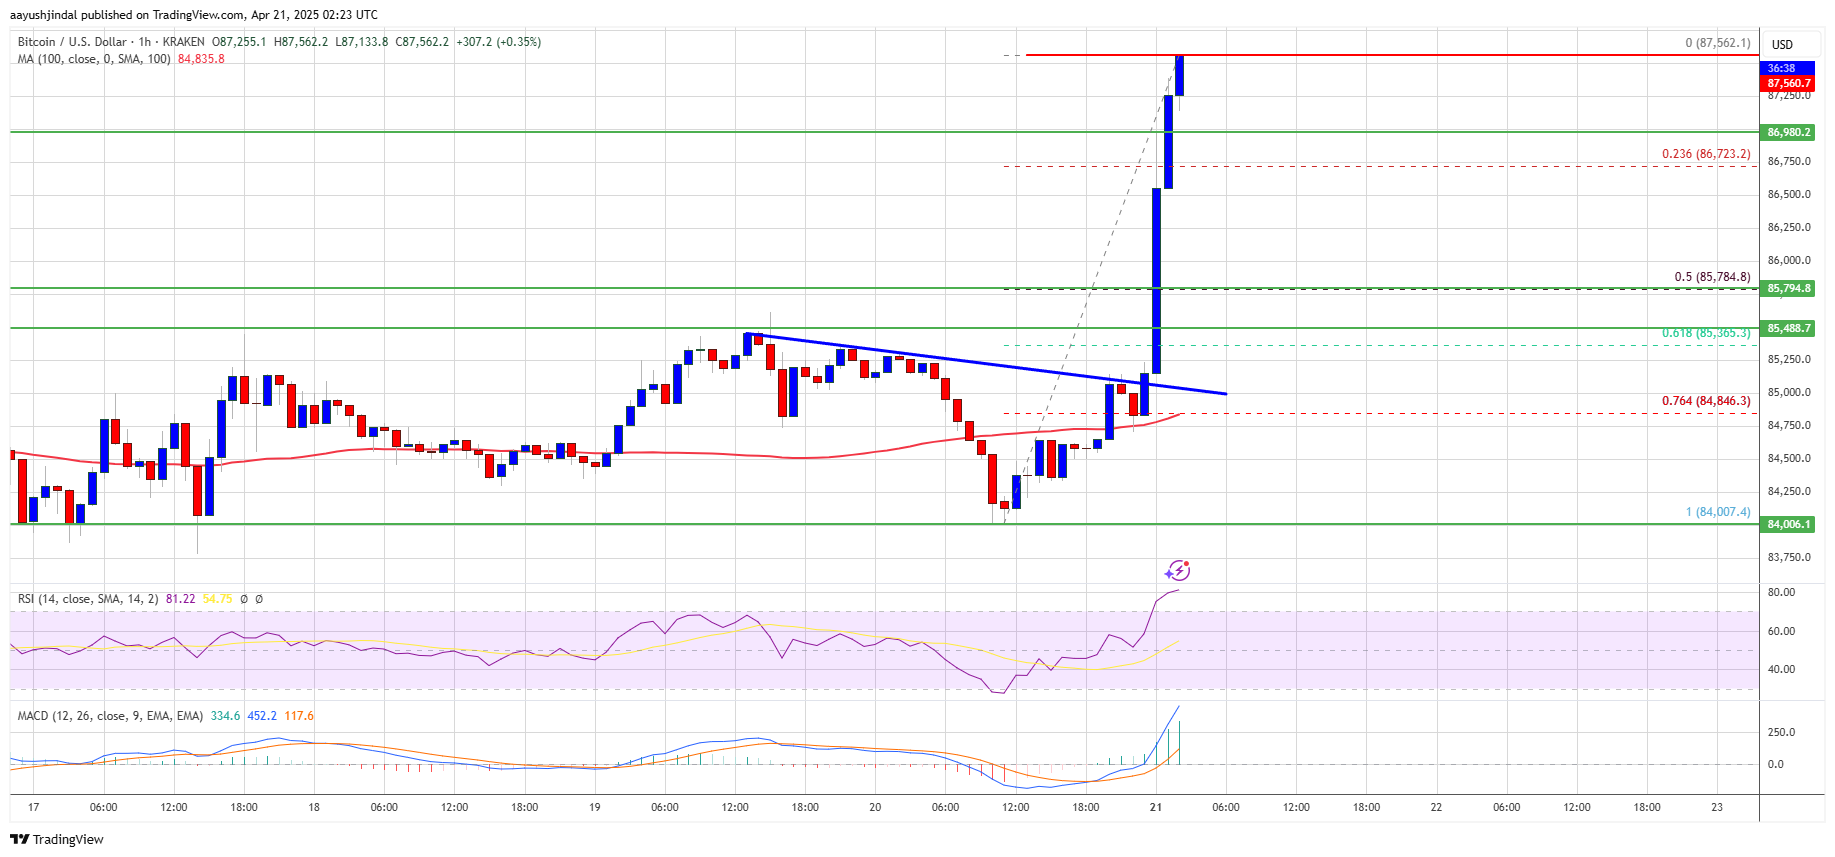
There was a break above a connecting bearish trend line with resistance at $85,000 on the hourly chart of the BTC/USD pair (data feed from Kraken).
The pair could start another increase if it clears the $88,000 zone.
Bitcoin price remained stable above the $83,200 level and started a fresh increase. BTC was able to climb above the $84,200 and $85,000 resistance levels.
There was a break above a connecting bearish trend line with resistance at $85,000 on the hourly chart of the BTC/USD pair. The bulls were able to pump the price above the $86,500 resistance. It even spiked above $87,000. A high is formed near $87,562 and the price might continue to rise unless there is a move below the 23.6% Fib retracement level of the upward move from the $84,007 swing low to the $87,562 high.
Bitcoin price is now trading above $86,500 and the 100 hourly Simple moving average. On the upside, immediate resistance is near the $87,500 level. The first key resistance is near the $88,000 level.
The next key resistance could be $88,800. A close above the $88,800 resistance might send the price further higher. In the stated case, the price could rise and test the $89,500 resistance level. Any more gains might send the price toward the $90,000 level.
If Bitcoin fails to rise above the $88,000 resistance zone, it could start a downside correction. Immediate support on the downside is near the $87,000 level. The first major support is near the $86,750 level.
The next support is now near the $86,000 zone. Any more losses might send the price toward the $85,750 support or the 50% Fib retracement level of the upward move from the $84,007 swing low to the $87,562 high in the near term. The main support sits at $84,850.
Technical indicators:
Hourly MACD – The MACD is now gaining pace in the bullish zone.
Hourly RSI (Relative Strength Index) – The RSI for BTC/USD is now above the 50 level.
Major Support Levels – $86,750, followed by $86,000.
Major Resistance Levels – $87,500 and $88,000.
[#item_full_content]NewsBTCRead MoreBitcoin Magazine South Korean Lender Jeonbuk Bank to Offer Bitcoin-Backed Loans Jeonbuk Bank has become…
Bitcoin Magazine Moscow Exchange to Launch Bitcoin Trading, Testing Underway The Moscow Exchange plans to…
Bitcoin Magazine Bitcoin Extends Slide — Can ‘Uptober’ 2026 Beat Last Year’s? Bitcoin’s price dipped…
Bitcoin Magazine Strategy Smash Buys $21.5M in Bitcoin as It Continues BTC Accumulation Bitcoin juggernaut…
Bitcoin Magazine Willem Middelkoop: Bitcoin is the Fastest Horse – Why the Debasement Trade Takes…
Bitcoin Magazine Ark Invest’s Lorenzo Valente: Bitcoin’s 5-Year Forecast – Stablecoin & Gold Impacts Bitcoin…