Bitcoin price started a recovery wave above the $105,000 zone. BTC is now consolidating and might attempt to clear the $106,500 resistance.
Bitcoin started a recovery wave above the $105,000 zone.
The price is trading above $105,000 and the 100 hourly Simple moving average.
There is a bullish trend line forming with support at $105,350 on the hourly chart of the BTC/USD pair (data feed from Kraken).
The pair could start a fresh decline if it breaks the $104,000 support zone.
Bitcoin price started a fresh decline and traded below the $102,500 support zone. BTC even traded close to the $100,000 zone before the bulls appeared.
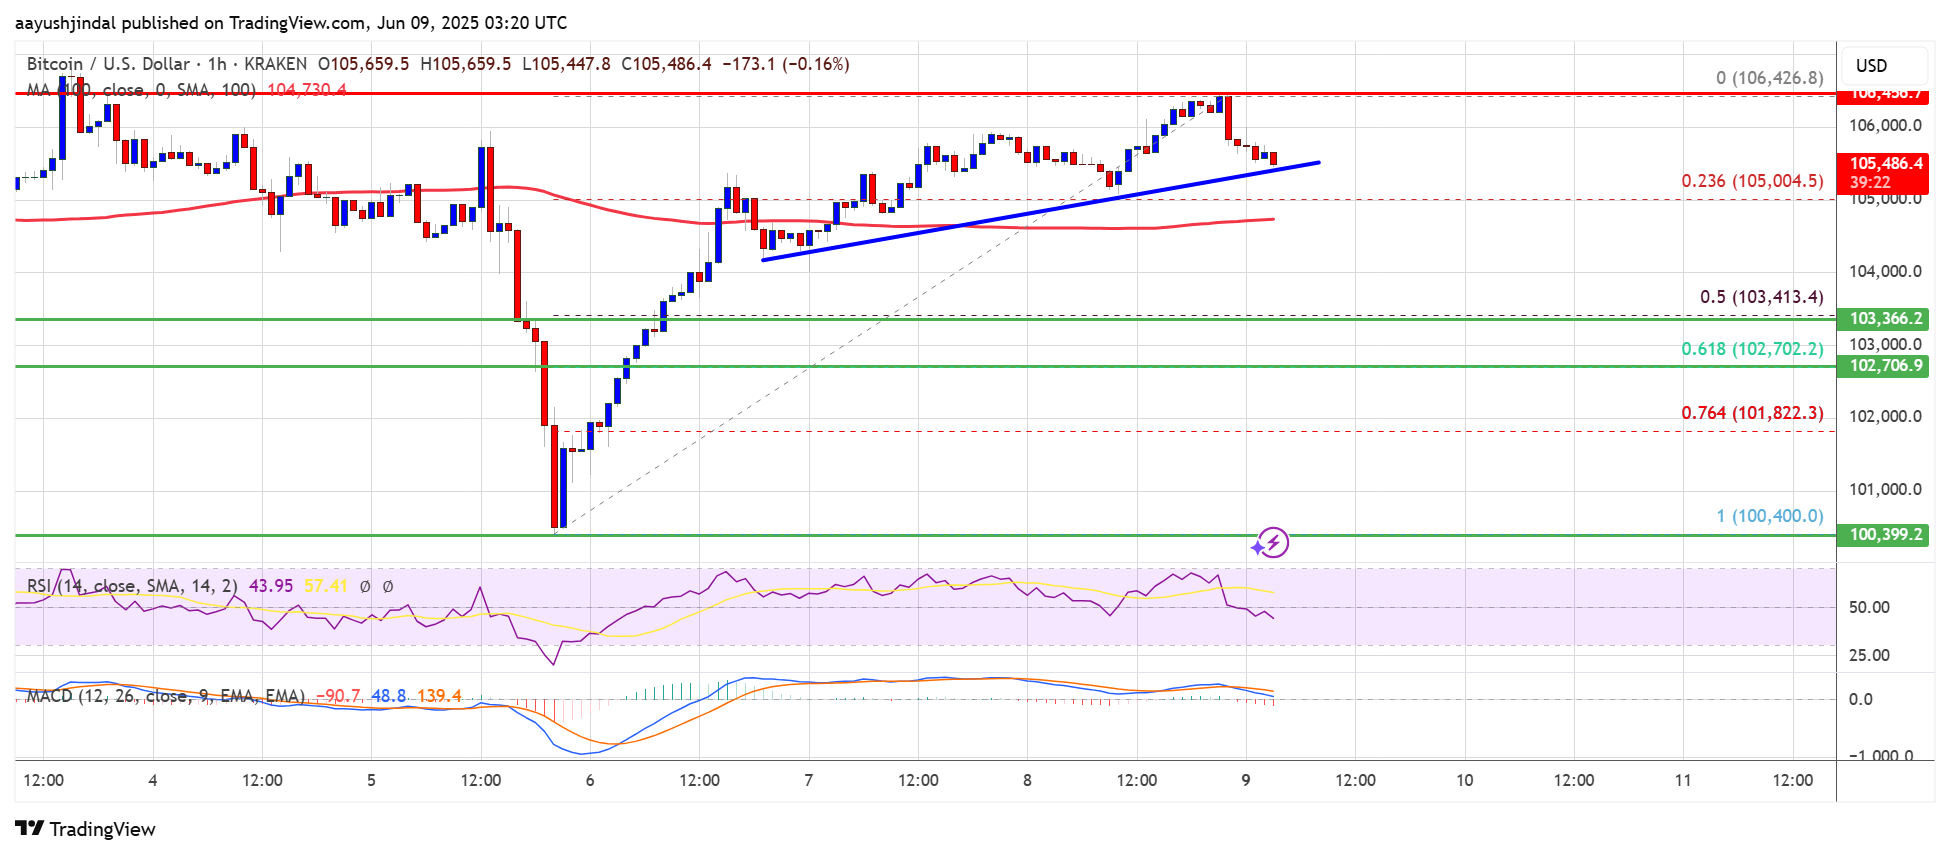
A low was formed and the price recovered above the $103,500 resistance. The bulls even pushed the price above the $105,000 resistance. A high was formed at $106,426 and the price is now consolidating gains above the 23.6% Fib retracement level of the upward move from the $100,400 swing low to the $106,426 high.
Bitcoin is now trading above $105,000 and the 100 hourly Simple moving average. There is also a bullish trend line forming with support at $105,350 on the hourly chart of the BTC/USD pair.
On the upside, immediate resistance is near the $106,200 level. The first key resistance is near the $106,500 level. The next key resistance could be $107,600. A close above the $107,600 resistance might send the price further higher. In the stated case, the price could rise and test the $108,800 resistance level. Any more gains might send the price toward the $110,000 level.
If Bitcoin fails to rise above the $106,200 resistance zone, it could start another decline. Immediate support is near the $105,200 level and the trend line. The first major support is near the $103,500 level and the 50% Fib retracement level of the upward move from the $100,400 swing low to the $106,426 high.
The next support is now near the $102,000 zone. Any more losses might send the price toward the $100,500 support in the near term. The main support sits at $100,000, below which BTC might gain bearish momentum.
Technical indicators:
Hourly MACD – The MACD is now gaining pace in the bullish zone.
Hourly RSI (Relative Strength Index) – The RSI for BTC/USD is now above the 50 level.
Major Support Levels – $105,200, followed by $103,500.
Major Resistance Levels – $106,200 and $107,600.
[#item_full_content]NewsBTCRead MoreBitcoin Magazine Paolo Ardoino Confirmed as a Bitcoin 2026 Speaker Paolo Ardoino has been officially…
A 33-day dry spell for solo Bitcoin miners ended last week when one small operator…
Crypto analyst Kabuki has explained why the Bitcoin rainbow chart shows that the price range…
Bitcoin Magazine Even a 1% Bitcoin Allocation Can Drastically Reshape Portfolio Risk, Schwab Finds A…
The asset manager's research arm argues the technical path to quantum-safe blockchains is clear but…
Bitcoin Magazine Morgan Stanley’s Bitcoin ETF MBST To Go Live Tomorrow, 16,000 Advisors Ready To…