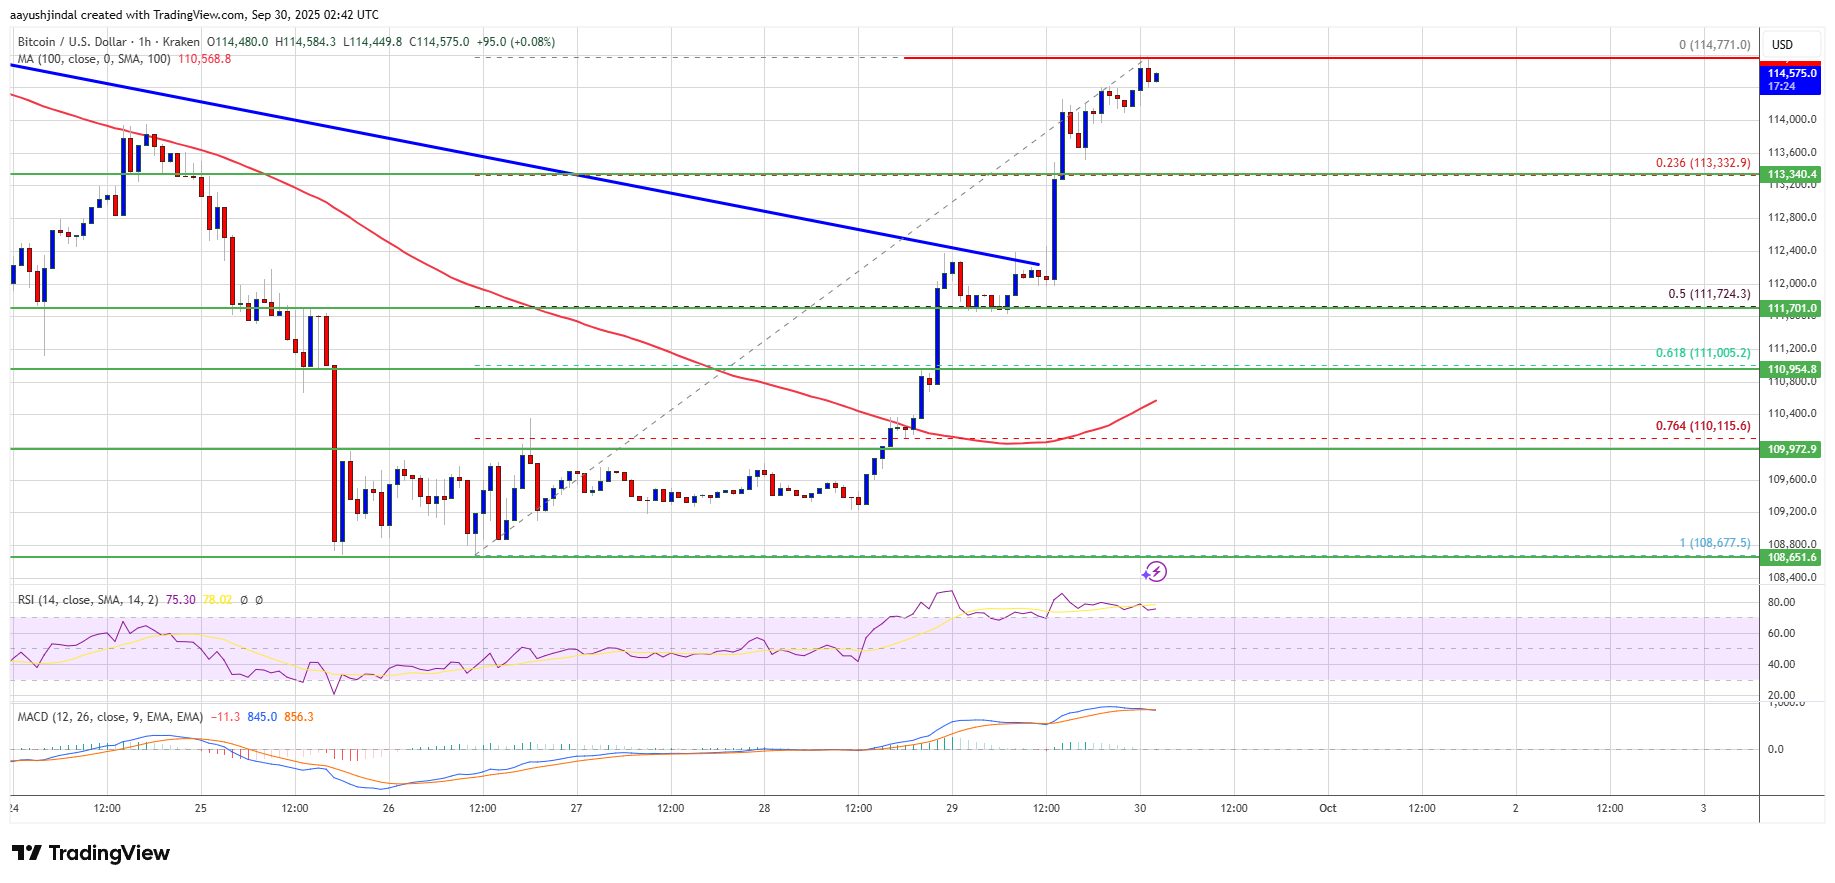
Bitcoin price started a recovery wave and traded above $114,000. BTC is trading above $114,000 and facing hurdles near $115,000.
Bitcoin started a fresh recovery wave above the $113,500 zone.
The price is trading above $114,000 and the 100 hourly Simple moving average.
There was a break above a key bearish trend line with resistance at $112,200 on the hourly chart of the BTC/USD pair (data feed from Kraken).
The pair might continue to move up if it clears the $115,000 zone.
Bitcoin price managed to stay above the $110,500 zone and started a recovery wave. BTC settled above the $112,500 resistance zone to start the current move.
The bulls were able to pump the price above the $113,500 and $114,000 levels. Besides, there was a break above a key bearish trend line with resistance at $112,200 on the hourly chart of the BTC/USD pair. The bulls even cleared the $114,000 level.
A high was formed at $114,771 and the price is now consolidating gains above the 23.6% Fib retracement level of the upward move from the $108,677 swing low to the $114,771 high. Bitcoin is now trading above $114,000 and the 100 hourly Simple moving average.
Immediate resistance on the upside is near the $114,750 level. The first key resistance is near the $115,000 level. The next resistance could be $115,500. A close above the $115,500 resistance might send the price further higher. In the stated case, the price could rise and test the $116,500 resistance. Any more gains might send the price toward the $117,500 level. The next barrier for the bulls could be $118,00.
If Bitcoin fails to rise above the $115,000 resistance zone, it could start a fresh decline. Immediate support is near the $113,500 level. The first major support is near the $112,500 level.
The next support is now near the $111,750 zone. Any more losses might send the price toward the $111,200 support in the near term. The main support sits at $110,500, below which BTC might struggle to recover in the short term.
Technical indicators:
Hourly MACD – The MACD is now gaining pace in the bullish zone.
Hourly RSI (Relative Strength Index) – The RSI for BTC/USD is now above the 50 level.
Major Support Levels – $113,500, followed by $112,500.
Major Resistance Levels – $114,750 and $115,000.
[#item_full_content]NewsBTCRead MoreCrypto analyst Ardi has pointed to a bear market divergence to explain what has been…
Bitcoin is hovering near the $71,000 mark, consolidating after recent swings as the market digests…
First-quarter purchases have reached 89,618 BTC so far, the most since fourth-quarter 2024, and the…
Bitcoin (BTC) is showing early signs of a prolonged decline after peaking in October 2025.…
According to a recent on-chain data evaluation, the Bitcoin price might not be seeing a…
The Bitcoin market remains subject to high uncertainty, with bearish sentiments at heightened levels. In…