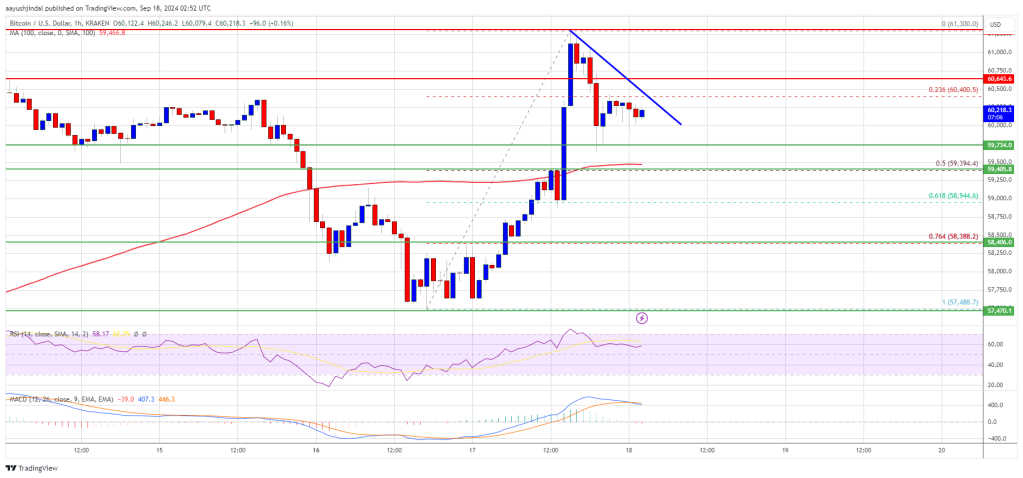
Bitcoin price started another increase above the $58,500 resistance. BTC is back above $60,000 and again struggling to continue higher.
Bitcoin is correcting gains from the $61,200 resistance zone.
The price is trading above $59,500 and the 100 hourly Simple moving average.
There is a connecting bearish trend line forming with resistance at $60,500 on the hourly chart of the BTC/USD pair (data feed from Kraken).
The pair could climb again if it stays above the $59,400 support zone.
Bitcoin price remained supported above the $57,500 level. BTC formed a base and started another increase above the $58,500 resistance zone. There was a clear move above the $60,000 level.
The price tested the $61,200 resistance zone. A high was formed at $61,300 and the price is now correcting gains. There was a move below the $60,500 level. The price dipped below the 23.6% Fib retracement level of the upward move from the $57,488 swing low to the $61,300 high.
Bitcoin is now trading above $59,500 and the 100 hourly Simple moving average. On the upside, the price could face resistance near the $60,500 level. There is also a connecting bearish trend line forming with resistance at $60,500 on the hourly chart of the BTC/USD pair.
The first key resistance is near the $60,650 level. A clear move above the $60,650 resistance might start a steady increase in the coming sessions. The next key resistance could be $61,200. A close above the $61,200 resistance might spark more upsides. In the stated case, the price could rise and test the $62,500 resistance.
If Bitcoin fails to rise above the $60,500 resistance zone, it could continue to move down. Immediate support on the downside is near the $60,000 level.
The first major support is $59,750. The next support is now near the $59,400 zone and the 100 hourly Simple moving average or the 50% Fib retracement level of the upward move from the $57,488 swing low to the $61,300 high. Any more losses might send the price toward the $58,450 support in the near term.
Technical indicators:
Hourly MACD – The MACD is now losing pace in the bullish zone.
Hourly RSI (Relative Strength Index) – The RSI for BTC/USD is now above the 50 level.
Major Support Levels – $60,000, followed by $59,400.
Major Resistance Levels – $60,500, and $61,200.
[#item_full_content]NewsBTCRead MoreThe Bitcoin and Ethereum prices plunged sharply over the weekend as missiles flew across the…
Post ContentRead MoreCoinDesk: Bitcoin, Ethereum, Crypto News and Price Data[#item_full_content]
A Bitcoin block signaling the BIP-110 proposal has appeared onchain while critics push back by…
Bitcoin Magazine Bitcoin Price Pumps 7% in Early Trading to Over $70,000 The bitcoin price…
Bitcoin Magazine Cake Wallet Launches Bitcoin Lightning Network Support With Full Self-Custody and Privacy Defaults…
At their worst levels, U.S. stock index futures had been down more than 2%, but…