Bitcoin price started a fresh increase above $96,000. BTC is correcting some gains and might decline to $94,000 before a fresh increase.
Bitcoin started a decent increase above $95,000 and $96,000.
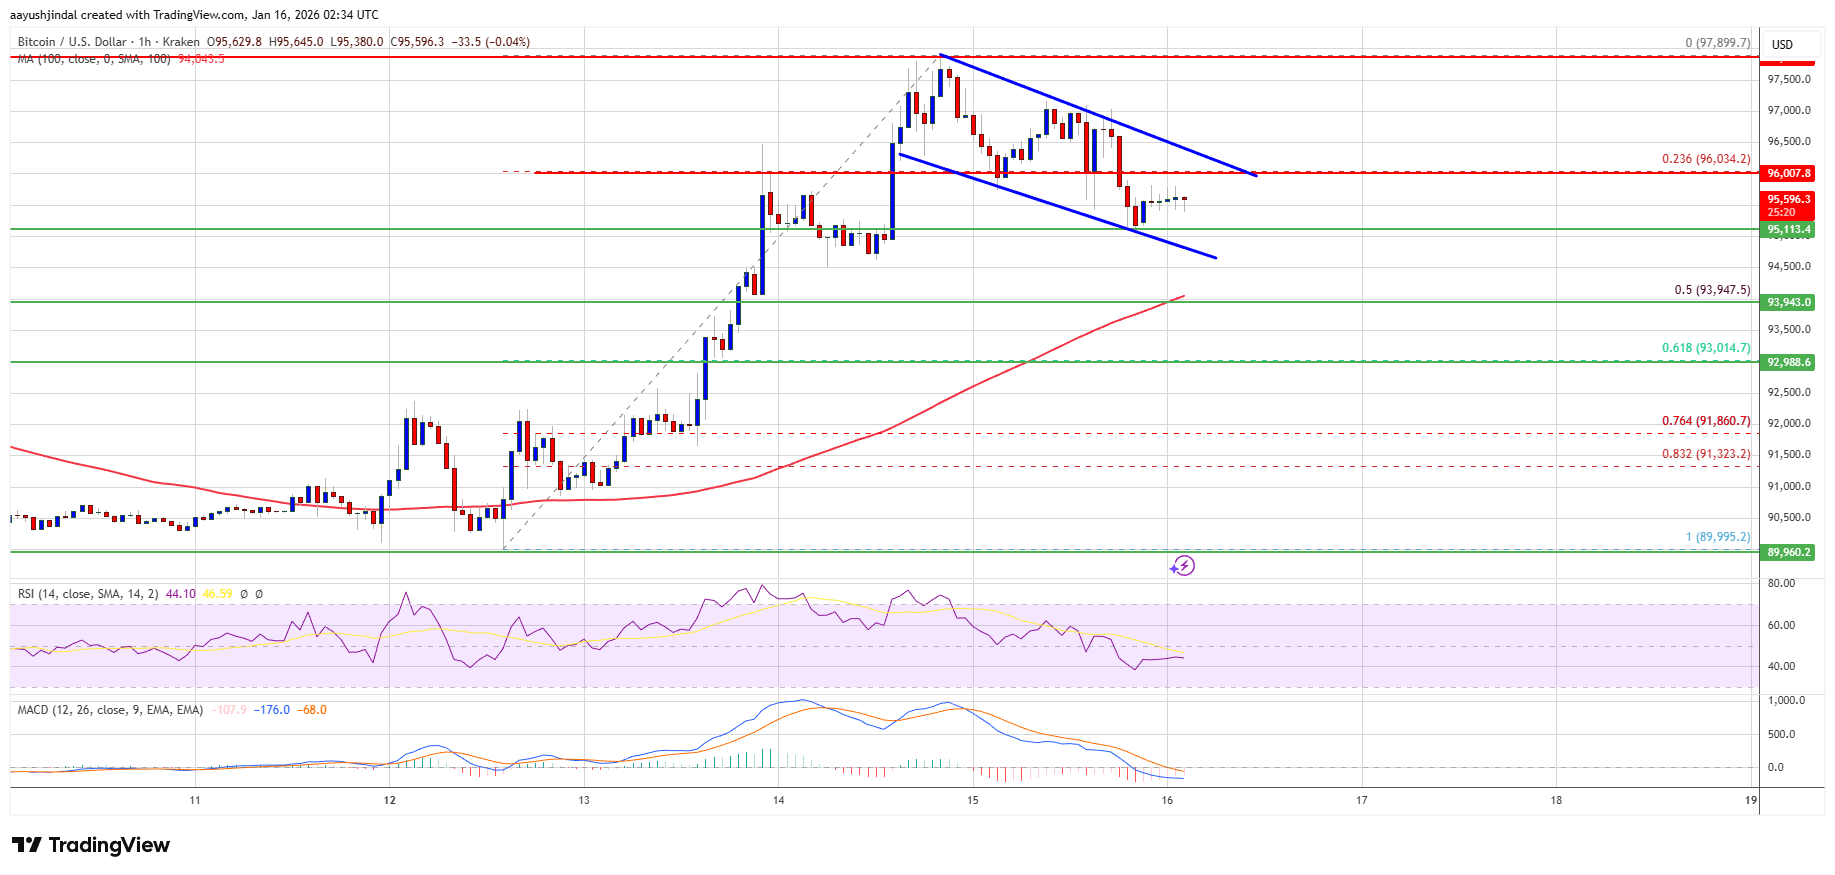
The price is trading above $95,000 and the 100 hourly Simple moving average.
There is a declining channel or a possible bullish flag forming with resistance at $96,200 on the hourly chart of the BTC/USD pair (data feed from Kraken).
The pair might continue to move up if it stays above the $95,000 zone.
Bitcoin price managed to stay above the $93,500 support and started a fresh increase. BTC was able to settle above $95,000 and $95,500.
The bulls were able to push the price above $96,000. Finally, the price spiked above $97,500. A high was formed at $97,898, and the price is now correcting some gains. There was a move below the 23.6% Fib retracement level of the recent wave from the $89,995 swing low to the $97,898 high.
Bitcoin is now trading above $95,000 and the 100 hourly Simple moving average. If the price remains stable above $95,000, it could attempt a fresh increase. Immediate resistance is near the $96,000 level. The first key resistance is near the $96,200 level. There is also a declining channel or a possible bullish flag forming with resistance at $96,200 on the hourly chart of the BTC/USD pair.
The next resistance could be $97,000. A close above the $97,000 resistance might send the price further higher. In the stated case, the price could rise and test the $97,800 resistance. Any more gains might send the price toward the $98,800 level. The next barrier for the bulls could be $99,200 and $100,000.
If Bitcoin fails to rise above the $96,200 resistance zone, it could start another decline. Immediate support is near the $95,000 level. The first major support is near the $94,000 level and the 50% Fib retracement level of the recent wave from the $89,995 swing low to the $97,898 high.
The next support is now near the $93,000 zone. Any more losses might send the price toward the $91,850 support in the near term. The main support sits at $91,500, below which BTC might accelerate lower in the near term.
Technical indicators:
Hourly MACD – The MACD is now losing pace in the bullish zone.
Hourly RSI (Relative Strength Index) – The RSI for BTC/USD is now below the 50 level.
Major Support Levels – $95,000, followed by $94,000.
Major Resistance Levels – $96,200 and $97,000.
[#item_full_content]NewsBTCRead MoreThe headline number is useful, but the real story is what it says about positioning.…
Bitcoin Magazine Bitcoin Exchange Inflows Spike to 49,000 BTC in a Day, Signaling More Volatility…
Bitcoin Magazine Wavespace Launches MiCA-Compliant Self-Custodial Bitcoin Debit Card Powered by Lightning and NWC Wavespace,…
For readers tracking where the market is actually changing, this is the part that matters.…
The headline number is useful, but the real story is what it says about positioning.…
Miners must redirect their hashrate before the July 31 cutoff, as the pool will stop…