Bitcoin price failed to stay above $70,000 and started another decline. BTC is now trading below $68,800 and might extend losses in the near term.
Bitcoin is slowly moving lower below $68,800 and $68,000.
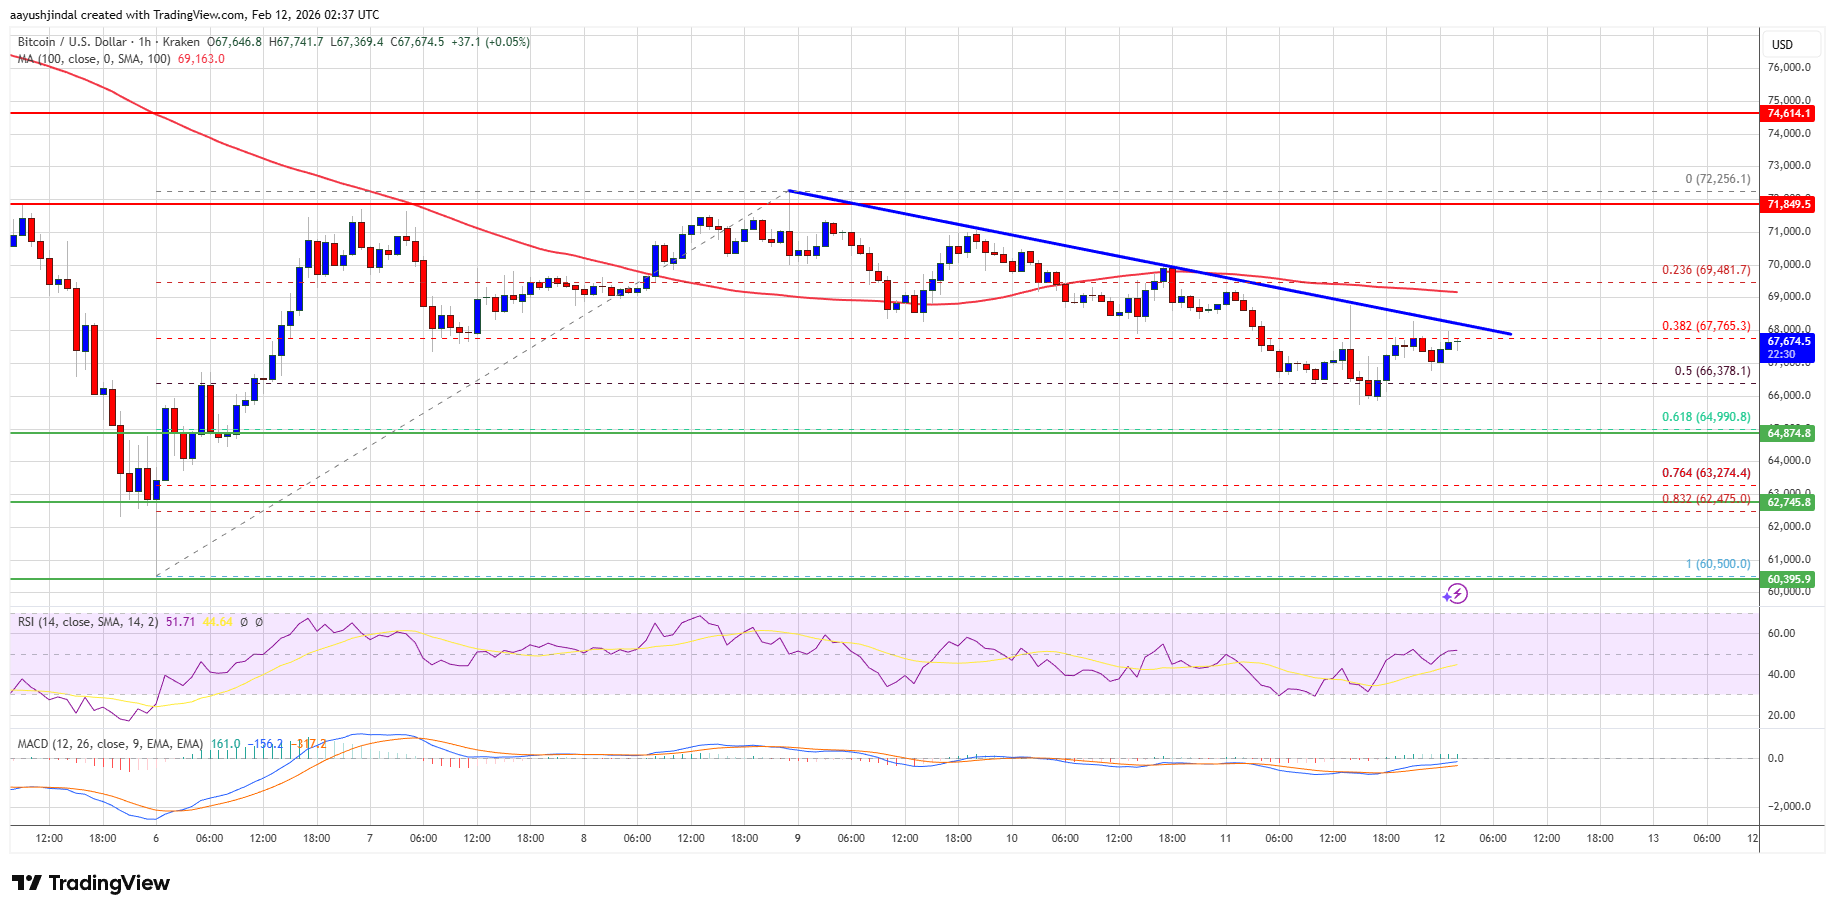
The price is trading below $68,000 and the 100 hourly simple moving average.
There is a bearish trend line forming with resistance at $68,200 on the hourly chart of the BTC/USD pair (data feed from Kraken).
The pair might dip again if it trades below the $66,500 and $65,000 levels.
Bitcoin price failed to remain stable above the $70,000 zone. BTC started a fresh decline and traded below the $68,800 support zone. There was a push below $68,000.
The price dipped below the 50% Fib retracement level of the upward move from the $60,500 swing low to the $72,256 high. There is also a bearish trend line forming with resistance at $68,200 on the hourly chart of the BTC/USD pair.
Bitcoin is now trading below $68,000 and the 100 hourly simple moving average. If the price remains stable above $65,000, it could attempt a fresh increase. Immediate resistance is near the $68,200 level and the trend line.
The first key resistance is near the $69,000 level. A close above the $69,000 resistance might send the price further higher. In the stated case, the price could rise and test the $70,000 resistance. Any more gains might send the price toward the $71,500 level. The next barrier for the bulls could be $72,000 and $72,500.
If Bitcoin fails to rise above the $69,000 resistance zone, it could start another decline. Immediate support is near the $66,000 level. The first major support is near the $65,000 level or the 61.8% Fib retracement level of the upward move from the $60,500 swing low to the $72,256 high.
The next support is now near the $63,500 zone. Any more losses might send the price toward the $62,000 support in the near term. The main support now sits at $61,200, below which BTC might struggle to recover in the near term.
Technical indicators:
Hourly MACD – The MACD is now gaining pace in the bearish zone.
Hourly RSI (Relative Strength Index) – The RSI for BTC/USD is now below the 50 level.
Major Support Levels – $66,000, followed by $65,000.
Major Resistance Levels – $69,000 and $70,000.
[#item_full_content]NewsBTCRead MoreBitcoin’s miner supply picture remains tighter than in past cycles, but not tight enough to…
A crypto analyst has issued a bold long-term forecast for Bitcoin, predicting that a capital…
Bitcoin is holding above $70,000. The number looks resilient. The geography behind it tells a…
Crypto analyst Crypto Patel has outlined a roadmap for how Bitcoin could rally to $300,000.…
Strategy, the Michael Saylor-led company that has made Bitcoin accumulation its core business, bought $76.6…
Bitcoin Magazine Bitcoin Volatility Falls as Asset Matures, Charles Schwab Report Finds A new report…