Bitcoin price failed to stay above $68,800 and started another decline. BTC is now trading below $67,500 and might extend losses in the near term.
Bitcoin is slowly moving lower below $68,000 and $67,500.
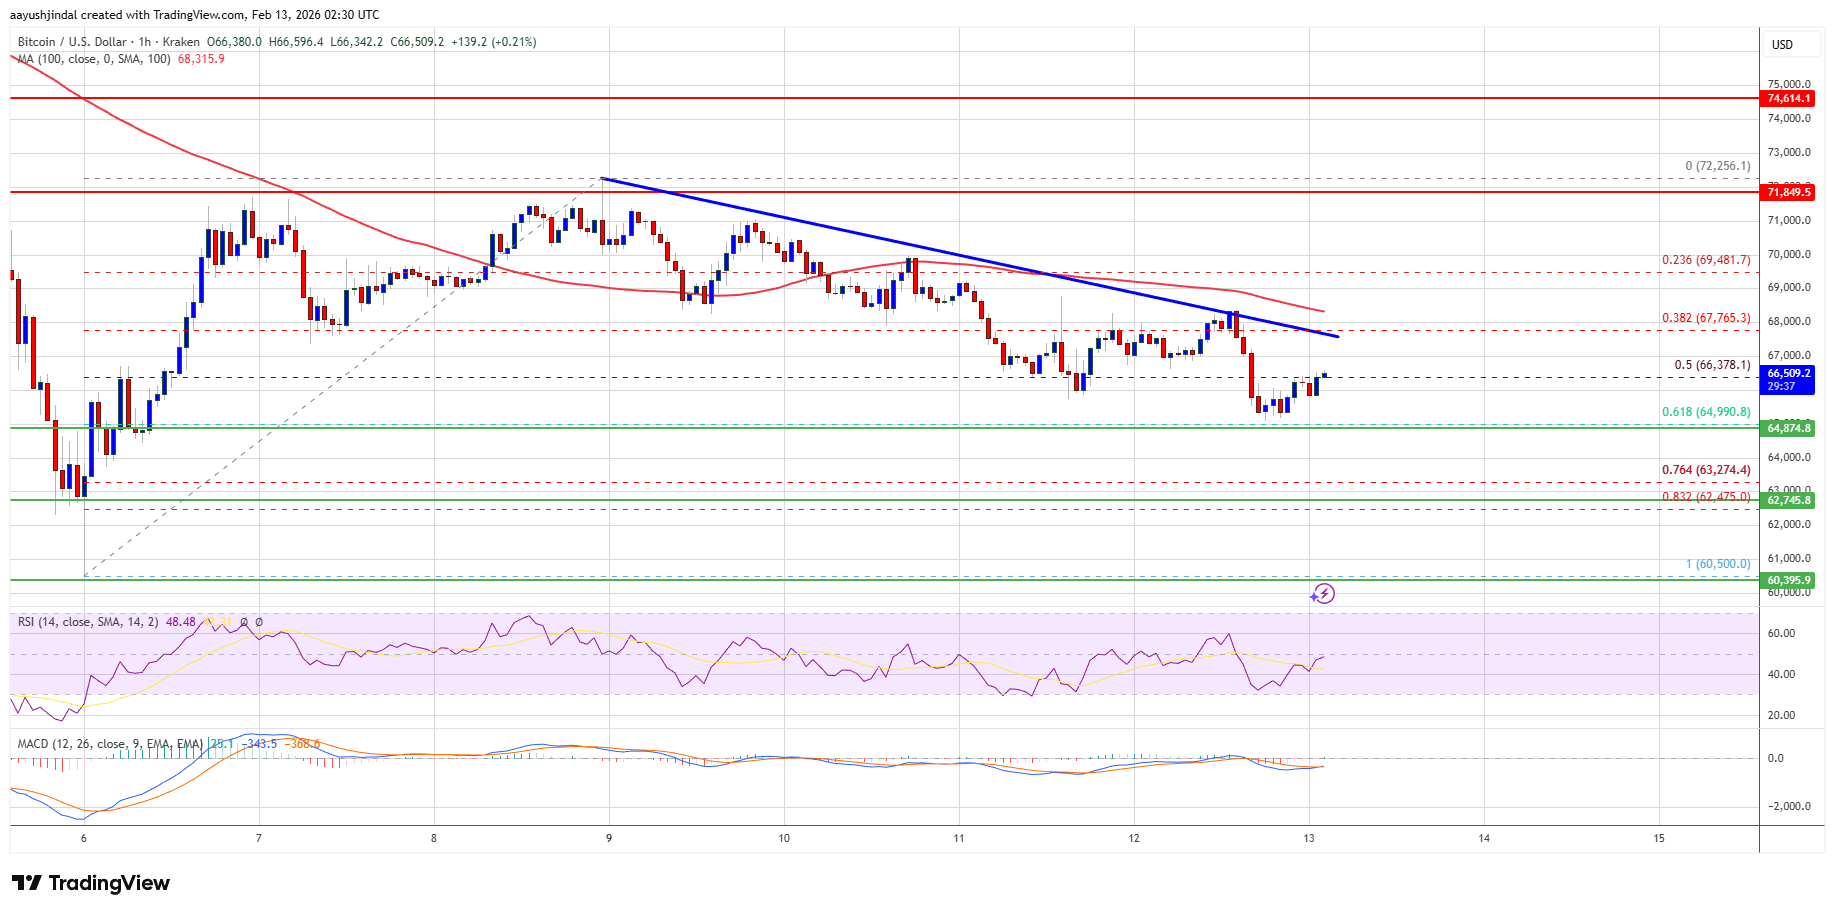
The price is trading below $67,000 and the 100 hourly simple moving average.
There is a bearish trend line forming with resistance at $67,500 on the hourly chart of the BTC/USD pair (data feed from Kraken).
The pair might dip again if it trades below the $66,000 and $65,000 levels.
Bitcoin price failed to remain stable above the $68,800 zone. BTC started a fresh decline and traded below the $68,000 support zone. There was a push below $67,000.
The price dipped below the 50% Fib retracement level of the upward move from the $60,500 swing low to the $72,255 high. The bears even pushed the price below $65,500. Besides, there is a bearish trend line forming with resistance at $67,500 on the hourly chart of the BTC/USD pair.
Bitcoin is now trading below $67,000 and the 100 hourly simple moving average. If the price remains stable above $65,000, it could attempt a fresh increase. Immediate resistance is near the $67,500 level and the trend line.
The first key resistance is near the $68,000 level. A close above the $68,000 resistance might send the price further higher. In the stated case, the price could rise and test the $69,200 resistance. Any more gains might send the price toward the $70,500 level. The next barrier for the bulls could be $72,000 and $72,500.
If Bitcoin fails to rise above the $68,000 resistance zone, it could start another decline. Immediate support is near the $65,500 level. The first major support is near the $65,000 level or the 61.8% Fib retracement level of the upward move from the $60,500 swing low to the $72,255 high.
The next support is now near the $62,750 zone. Any more losses might send the price toward the $61,200 support in the near term. The main support now sits at $60,500, below which BTC might struggle to recover in the near term.
Technical indicators:
Hourly MACD – The MACD is now gaining pace in the bearish zone.
Hourly RSI (Relative Strength Index) – The RSI for BTC/USD is now below the 50 level.
Major Support Levels – $66,000, followed by $65,000.
Major Resistance Levels – $67,500 and $68,000.
[#item_full_content]NewsBTCRead MoreBTC fell 2.2% as $299 million in liquidations hit crypto markets, with long positions accounting…
The average production cost was sitting at $88,000 per bitcoin in mid-March, according to Checkonchain's…
Traders are watching support near $1.40 as repeated failures below $1.60 reinforce broader downtrend.Read MoreCoinDesk:…
Bitcoin quietly gained ground while gold crumbled. That contrast has become one of the more…
Despite stabilizing spot prices, investors remain defensive, with leveraged speculation cooling and realized volatility dropping…
Crypto analyst Ardi has pointed to a bear market divergence to explain what has been…