Bitcoin price started a downside correction from the $64,600 zone. BTC is showing bearish signs and might continue lower below $61,200.
Bitcoin failed to stay above $64,000 and extended losses.
The price is trading below $62,800 and the 100 hourly simple moving average.
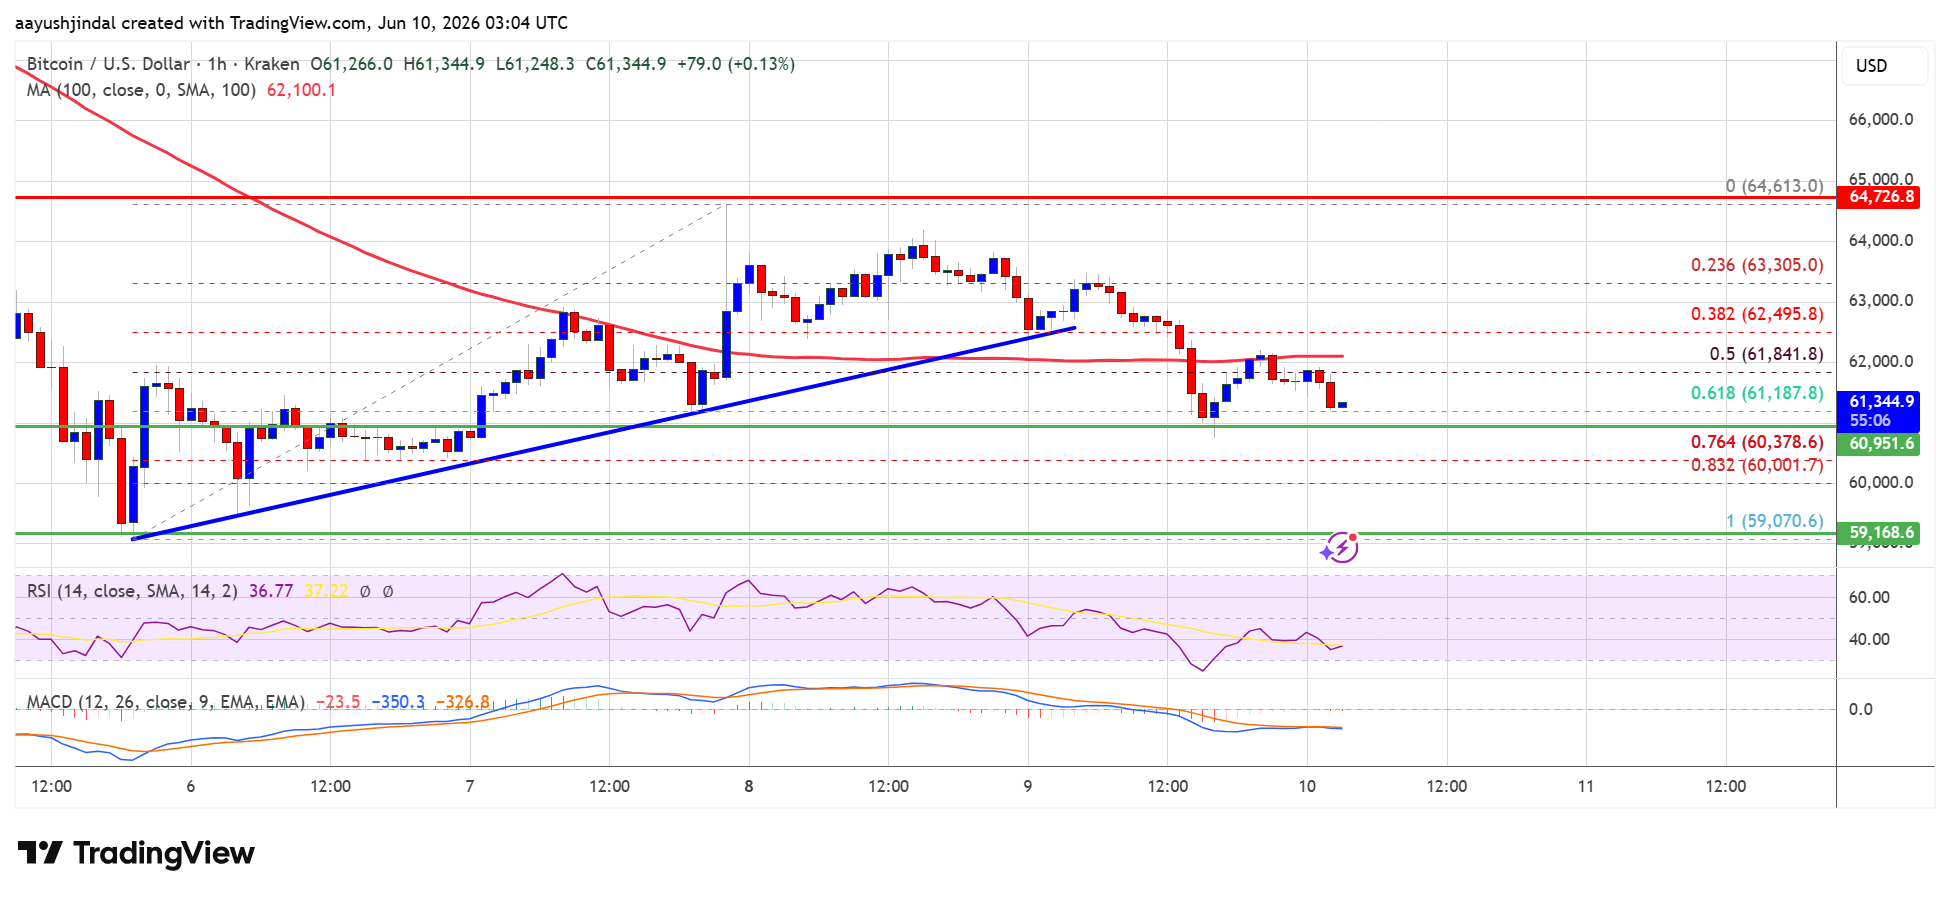
There was a break below a bullish trend line with support at $62,500 on the hourly chart of the BTC/USD pair (data feed from Kraken).
The pair might extend losses if it stays below the $62,500 and $62,200 levels.
Bitcoin price failed to clear the $64,500 resistance zone. BTC started a downside correction and declined below the key support at $63,500 to enter a bearish zone.
There was a move below the 50% Fib retracement level of the upward move from the $59,070 swing low to the $64,613 high. Besides, there was a break below a bullish trend line with support at $62,500 on the hourly chart of the BTC/USD pair.
Bitcoin is now trading below $62,500 and the 100 hourly simple moving average. If the price remains stable above $61,500, it could attempt a fresh increase. Immediate resistance is near the $62,000 level. The first key resistance is near the $62,200 level.
A close above the $62,200 resistance might send the price further higher. In the stated case, the price could rise and test the $64,000 resistance. The next resistance could be near the $64,500 level. Any more gains might send the price toward the $66,000 level. The main hurdle for the bulls could be $66,500.
If Bitcoin fails to rise above the $62,500 resistance zone, it could start another decline. Immediate support is near the $61,200 level or the 61.8% Fib retracement level of the upward move from the $59,070 swing low to the $64,613 high.
The first major support is near the $60,950 level. The next support is now near the $60,200 zone. Any more losses might send the price toward the $59,000 support in the near term. The main support now sits at $58,500, below which BTC might struggle to recover in the near term.
Technical indicators:
Hourly MACD – The MACD is now gaining pace in the bearish zone.
Hourly RSI (Relative Strength Index) – The RSI for BTC/USD is now below the 50 level.
Major Support Levels – $61,200, followed by $60,200.
Major Resistance Levels – $62,500 and $64,000.
[#item_full_content]NewsBTCRead MoreBitcoin is holding above $62,000 after the massive drop that defined last week’s market action…
On-chain data shows the RSI of the Bitcoin Stablecoin Supply Ratio (SSR) has dropped to…
Technical analysis of Bitcoin’s price action on the daily candlestick timeframe places the cryptocurrency around…
Arthur Hayes has turned sharply defensive on risk assets, warning that an AI stock-market unwind…
Bitcoin’s latest upward move has sparked debate among market participants, and some believe the rally…
Bitcoin Magazine New Documentary ‘Bitcoin Season’ Charts Bitcoin’s Push Into the NBA A new feature…