Bitcoin price trimmed losses and climbed above $37,750. BTC gained pace but it is still struggling to clear the $38,500 resistance zone.
Bitcoin is again facing heavy resistance near the $38,500 zone.
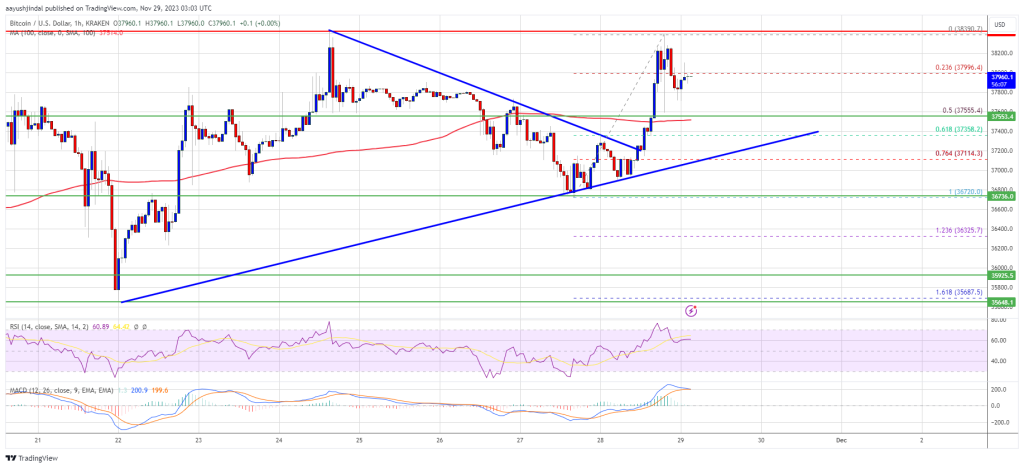
The price is trading above $37,500 and the 100 hourly Simple moving average.
There was a break above a major bearish trend line with resistance near $37,250 on the hourly chart of the BTC/USD pair (data feed from Kraken).
The pair is struggling to clear the $38,500 resistance and correcting gains.
Bitcoin price revisited the $36,720 support zone. BTC managed to avoid a collapse and started a fresh increase above the $37,000 level. There was a clear move above the $37,500 level.
Besides, there was a break above a major bearish trend line with resistance near $37,250 on the hourly chart of the BTC/USD pair. The pair surged above the $37,750 resistance. However, the bears were again active near the $38,500 resistance.
A high was formed near $38,390 and the price is now correcting gains. There was a move below the 23.6% Fib retracement level of the recent wave from the $36,720 swing low to the $38,390 high.
Bitcoin is now trading above $37,500 and the 100 hourly Simple moving average. On the upside, immediate resistance is near the $38,200 level. The first major resistance is forming near $38,400. The main resistance is now near the $38,500 level. A close above the $38,500 resistance might start a strong increase.
Source: BTCUSD on TradingView.com
The next key resistance could be near $39,200, above which BTC could rise toward the $39,500 level. Any more gains might send BTC toward the $40,000 resistance.
If Bitcoin fails to rise above the $38,400 resistance zone, it could start another decline. Immediate support on the downside is near the $37,600 level.
The next major support is $37,500 or the 50% Fib retracement level of the recent wave from the $36,720 swing low to the $38,390 high. If there is a move below $37,500, there is a risk of more downsides. In the stated case, the price could drop toward the $36,720 support in the near term.
Technical indicators:
Hourly MACD – The MACD is now losing pace in the bullish zone.
Hourly RSI (Relative Strength Index) – The RSI for BTC/USD is now above the 50 level.
Major Support Levels – $37,600, followed by $37,500.
Major Resistance Levels – $38,400, $38,500, and $39,200.
[#item_full_content]NewsBTCRead MoreU.S. spot crypto ETFs saw broad-based redemptions led by bitcoin and ether funds, while Solana…
Crypto lender packages more than 5,400 bitcoin collateralized loans into first asset backed securities transaction…
The altcoin market has faced persistent difficulties since 2024, with many assets still struggling to…
Heavy positioning at lower strikes signals rising demand for downside protection for bitcoin.Read MoreCoinDesk: Bitcoin,…
Geopolitical tensions lift the U.S. dollar and crude prices, adding pressure to an already fragile…
Bitcoin investors hoping for a familiar macro rescue may be reading the room wrong. In…