Bitcoin price is attempting to recover above $103,500. BTC could continue to move up if it clears the $106,500 resistance zone.
Bitcoin started a decent recovery wave above the $103,500 support.
The price is trading above $104,500 and the 100 hourly Simple moving average.
There was a break above a key bearish trend line with resistance at $102,000 on the hourly chart of the BTC/USD pair (data feed from Kraken).
The pair might continue to move up if it clears the $106,500 zone.
Bitcoin price managed to stay above the $101,000 support level and started a recovery wave. BTC recovered above the $102,500 and $103,500 resistance levels.
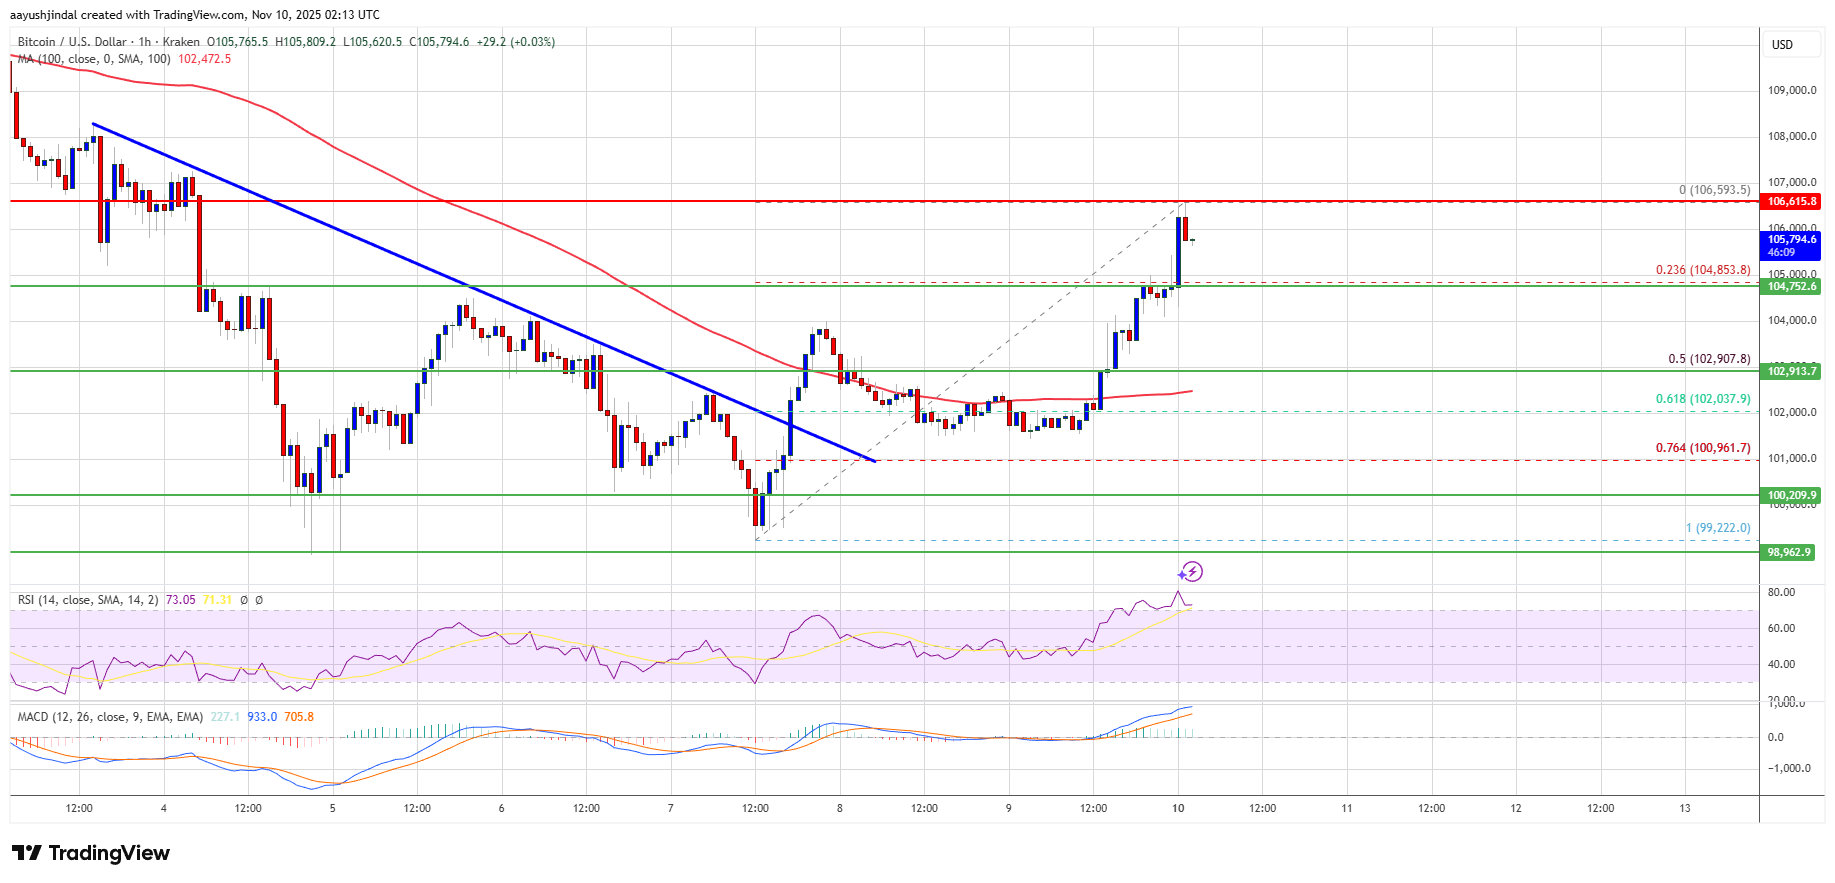
There was a break above a key bearish trend line with resistance at $102,000 on the hourly chart of the BTC/USD pair. The pair even climbed above $105,000. Finally, it tested the $106,500 resistance zone. A high was formed at $106,593 and the price is now consolidating gains above the 23.6% Fib retracement level of the upward move from the $99,222 swing low to the $106,593 high.
Bitcoin is now trading above $104,000 and the 100 hourly Simple moving average. If the bulls attempt another recovery wave, the price could face resistance near the $106,000 level. The first key resistance is near the $106,500 level.
The next resistance could be $107,500. A close above the $107,500 resistance might send the price further higher. In the stated case, the price could rise and test the $108,000 resistance. Any more gains might send the price toward the $109,200 level. The next barrier for the bulls could be $109,800 and $110,500.
If Bitcoin fails to rise above the $106,500 resistance zone, it could start another decline. Immediate support is near the $104,850 level. The first major support is near the $104,200 level.
The next support is now near the $103,500 zone. Any more losses might send the price toward the $102,900 support in the near term. The main support sits at $102,500, below which BTC might struggle to recover in the near term.
Technical indicators:
Hourly MACD – The MACD is now gaining pace in the bullish zone.
Hourly RSI (Relative Strength Index) – The RSI for BTC/USD is now above the 50 level.
Major Support Levels – $104,850, followed by $104,200.
Major Resistance Levels – $106,000 and $106,500.
[#item_full_content]NewsBTCRead MoreBinance founder Changpeng Zhao said Satoshi Nakamoto's bitcoin should be frozen before quantum computers can…
The token hit its highest in over a month during thin July 4 trading, with…
Researchers at Schwab and Hashdex said AI has diverted capital from digital assets while bitcoin…
This cycle, about $697 billion in new money has generated a roughly 689% gain, compared…
Your day-ahead look for July 3, 2026Read MoreCoinDesk: Bitcoin, Ethereum, Crypto News and Price Data[#item_full_content]
U.S. institutional demand had its worst month ever in June. Large holders absorbed the selling,…