Bitcoin price struggled to recover above the $68,800 resistance. BTC is now moving lower and there is a risk of more downsides below the $65,000 support.
Bitcoin price is struggling to start a fresh increase above the $68,000 zone.
The price is trading below $68,000 and the 100 hourly Simple moving average.
There is a connecting bearish trend line forming with resistance at $67,800 on the hourly chart of the BTC/USD pair (data feed from Kraken).
The pair could gain bullish momentum if it clears the $68,000 resistance zone in the near term.
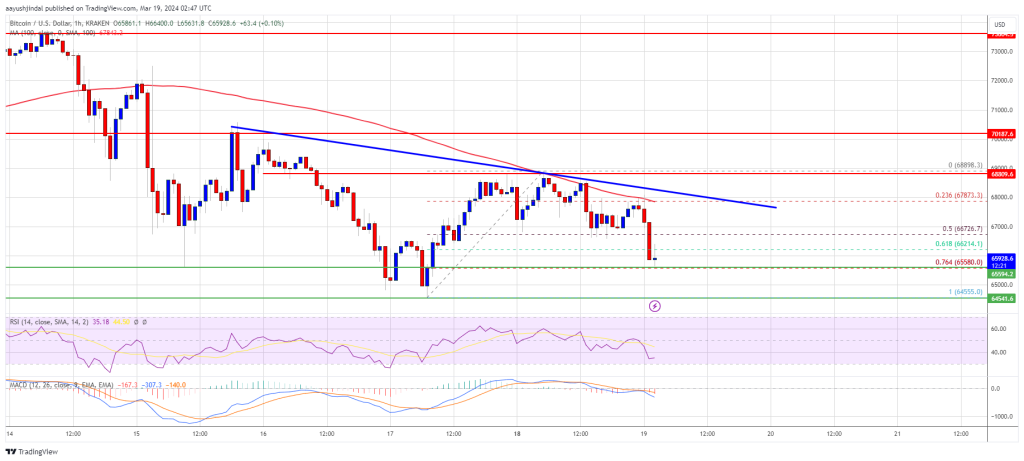
Bitcoin price attempted a fresh increase above the $65,500 zone. BTC climbed above the $67,200 and $68,000 levels. However, the bears were active near the $69,000 zone.
A high was formed at $68,898 and the price is now moving lower. There was a move below the $67,500 support zone. The price declined below the 50% Fib retracement level of the recovery wave from the $64,555 swing low to the $68,898 high.
Bitcoin is now trading below $68,000 and the 100 hourly Simple moving average. It is testing the 76.4% Fib retracement level of the recovery wave from the $64,555 swing low to the $68,898 high.
There is also a connecting bearish trend line forming with resistance at $67,800 on the hourly chart of the BTC/USD pair. Immediate resistance is near the $66,750 level. The next key resistance could be $67,800 or the trend line, above which the price could rise toward the $68,800 resistance zone.
Source: BTCUSD on TradingView.com
If there is a clear move above the $68,800 resistance zone, the price could even attempt a move above the $70,000 resistance zone. Any more gains might send the price toward the $71,200 level.
If Bitcoin fails to rise above the $67,800 resistance zone, it could start another decline. Immediate support on the downside is near the $65,550 level.
The first major support is $65,000. The main support sits at $64,500. If there is a close below $64,500, the price could start a drop toward the $63,500 level. Any more losses might send the price toward the $62,000 support zone.
Technical indicators:
Hourly MACD – The MACD is now gaining pace in the bearish zone.
Hourly RSI (Relative Strength Index) – The RSI for BTC/USD is now below the 50 level.
Major Support Levels – $65,500, followed by $65,000.
Major Resistance Levels – $67,800, $68,800, and $70,000.
[#item_full_content]NewsBTCRead MoreBitcoin's move, led by unwinding of shorts, has lifted the broader crypto market, with the…
A short message from Michael Saylor has once again stirred speculation that Strategy could be…
Bitcoin price started a strong increase above the $75,000 zone. BTC is now consolidating and…
A potential US military strike on Iran’s main oil export terminal helped push Bitcoin to…
Bitcoin Magazine Bitcoin Price Surges Above $75,000 as Bullish Momentum Builds The bitcoin price climbed…
The alleged theft of 2,323 bitcoin has triggered a High Court dispute testing how English…