Bitcoin price started another decline from the $60,650 resistance. BTC is now at risk of more downsides below the $57,500 support zone.
Bitcoin is correcting gains and gaining bearish pace below the $59,000 level.
The price is trading below $58,500 and the 100 hourly Simple moving average.
There is a connecting bearish trend line forming with resistance at $58,000 on the hourly chart of the BTC/USD pair (data feed from Kraken).
The pair could climb again if it stays above the $57,500 support zone.
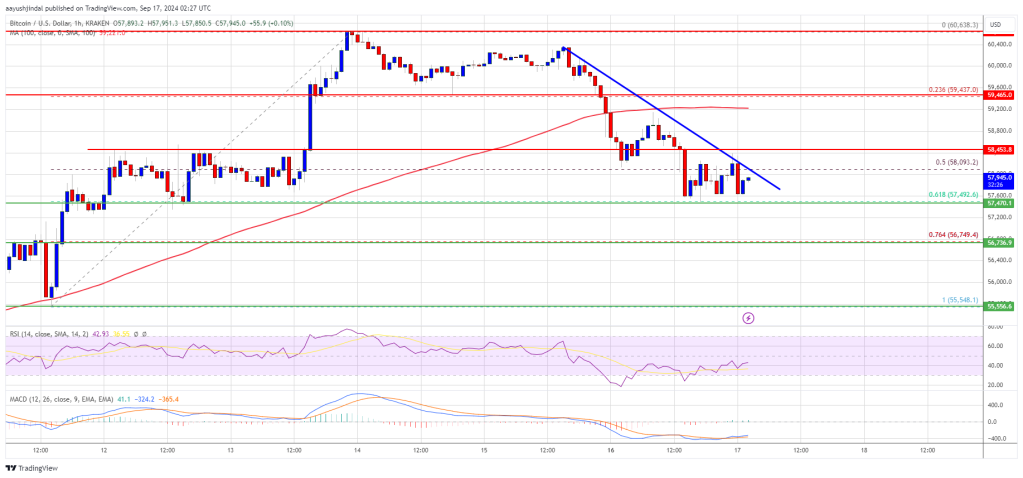
Bitcoin price struggled to clear the $60,000 resistance zone and started a fresh decline. BTC declined below the $60,000 and $59,500 levels to start a downside correction.
There was a drop below the 50% Fib retracement level of the upward move from the $55,550 swing low to the $60,638 high. The bears were able to push the price toward the $57,500 support zone. There is now a connecting bearish trend line forming with resistance at $58,000 on the hourly chart of the BTC/USD pair.
Bitcoin is now trading below $58,500 and the 100 hourly Simple moving average. It is testing the 61.8% Fib retracement level of the upward move from the $55,550 swing low to the $60,638 high.
On the upside, the price could face resistance near the $58,000 level and the trend line. The first key resistance is near the $59,200 level and the 100 hourly Simple moving average. A clear move above the $59,200 resistance might start a steady increase in the coming sessions.
The next key resistance could be $60,000. A close above the $60,000 resistance might spark more upsides. In the stated case, the price could rise and test the $60,650 resistance.
If Bitcoin fails to rise above the $58,000 resistance zone, it could continue to move down. Immediate support on the downside is near the $57,500 level.
The first major support is $56,750. The next support is now near the $56,250 zone. Any more losses might send the price toward the $55,550 support in the near term.
Technical indicators:
Hourly MACD – The MACD is now gaining pace in the bearish zone.
Hourly RSI (Relative Strength Index) – The RSI for BTC/USD is now below the 50 level.
Major Support Levels – $57,500, followed by $56,750.
Major Resistance Levels – $58,000, and $59,200.
[#item_full_content]NewsBTCRead MoreBlackRock's filing for a staking ether ETF earlier this week has contributed to ETH's relative…
Bitcoin Magazine On the value of holding the History of Bitcoin in your hands In…
The executive chairman of Strategy pitched BTC-backed banking and yield products as a $200 trillion…
Wall Street research firm Bernstein has reiterated one of the boldest long-term calls in traditional…
Bitcoin Magazine Bitcoin Price Skyrockets to $94,000 as Banks Start to Embrace Bitcoin The bitcoin…
The change from what's become typical bearish U.S. session action could signal seller exhaustion.Read MoreCoinDesk:…