Bitcoin price is struggling to settle above the $68,000 resistance. BTC is now consolidating and might decline toward the $63,400 support zone.
Bitcoin price is struggling to gain pace for more gains above the new all-time.
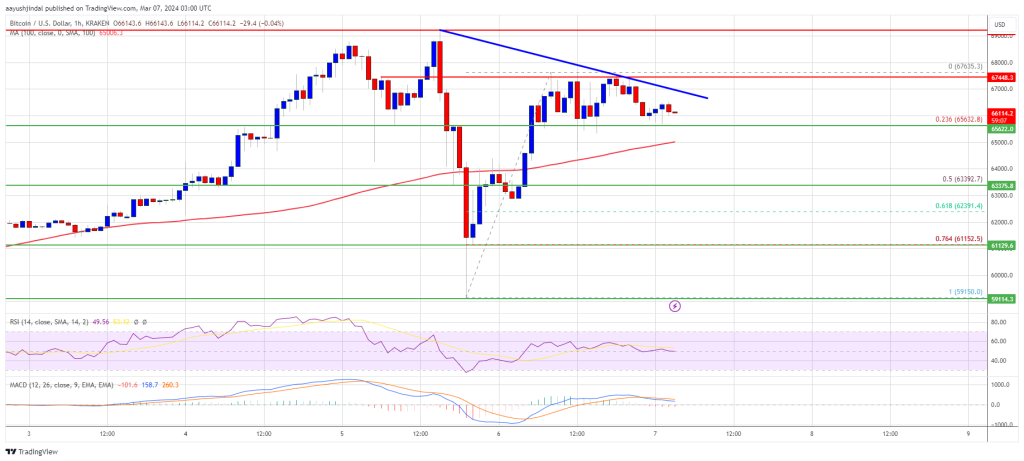
The price is trading above $65,000 and the 100 hourly Simple moving average.
There is a short-term bearish trend line forming with resistance near $67,000 on the hourly chart of the BTC/USD pair (data feed from Kraken).
The pair could extend losses and revisit the $63,400 support zone.
Bitcoin price started a nasty decline from the new all-time high of $69,218. BTC crashed to $59,150 before it trimmed losses. It climbed back above $65,000, but the bears are now protecting more upsides above the $67,500 level.
A high was formed at $67,635 and the price is now consolidating. It is trading above the 23.6% Fib retracement level of the upward move from the $59,150 swing low to the $67,635 high.
Bitcoin is still trading above $65,000 and the 100 hourly Simple moving average. Immediate resistance is near the $67,000 level. There is also a short-term bearish trend line forming with resistance near $67,000 on the hourly chart of the BTC/USD pair.
Source: BTCUSD on TradingView.com
The next key resistance could be $68,000, above which the price could rise toward the $69,200 resistance zone. If there is a clear move above the $69,200 resistance zone, the price could rise toward the $70,000 level. Any more gains might send the price toward the $72,000 level.
If Bitcoin fails to rise above the $67,000 resistance zone, it could start another downside correction. Immediate support on the downside is near the $66,650 level.
The first major support is $65,000. If there is a close below $65,000, the price could start a decent pullback toward the 50% Fib retracement level of the upward move from the $59,150 swing low to the $67,635 high at $63,400. Any more losses might send the price toward the $62,500 support zone.
Technical indicators:
Hourly MACD – The MACD is now gaining pace in the bearish zone.
Hourly RSI (Relative Strength Index) – The RSI for BTC/USD is now near the 50 level.
Major Support Levels – $65,000, followed by $63,400.
Major Resistance Levels – $67,000, $68,000, and $69,200.
[#item_full_content]NewsBTCRead MoreThe Bitcoin market appears to be entering a decisive holding phase, with on-chain data signaling…
Bitcoin Magazine Former LAPD Officer Convicted in $350,000 Bitcoin Kidnapping and Home Invasion A Los…
Bitcoin Magazine Arthur Hayes Confirmed As A Bitcoin 2026 Speaker Arthur Hayes, one of the…
Bitcoin Magazine Bitcoin Is The Collateral, It Just Needs The Credit Markets Bitcoin is the…
Iran war jitters attack once more, knocking investors out of risk assets and dragging the…
Bitcoin Magazine AI Agents Show Strong Preference for Bitcoin Over Fiat, BPI Study Finds A…