Bitcoin price started a fresh decline from the $73,800 zone. BTC is consolidating and might struggle to stay above the $70,500 support.
Bitcoin failed to stay above $72,500 and corrected gains.
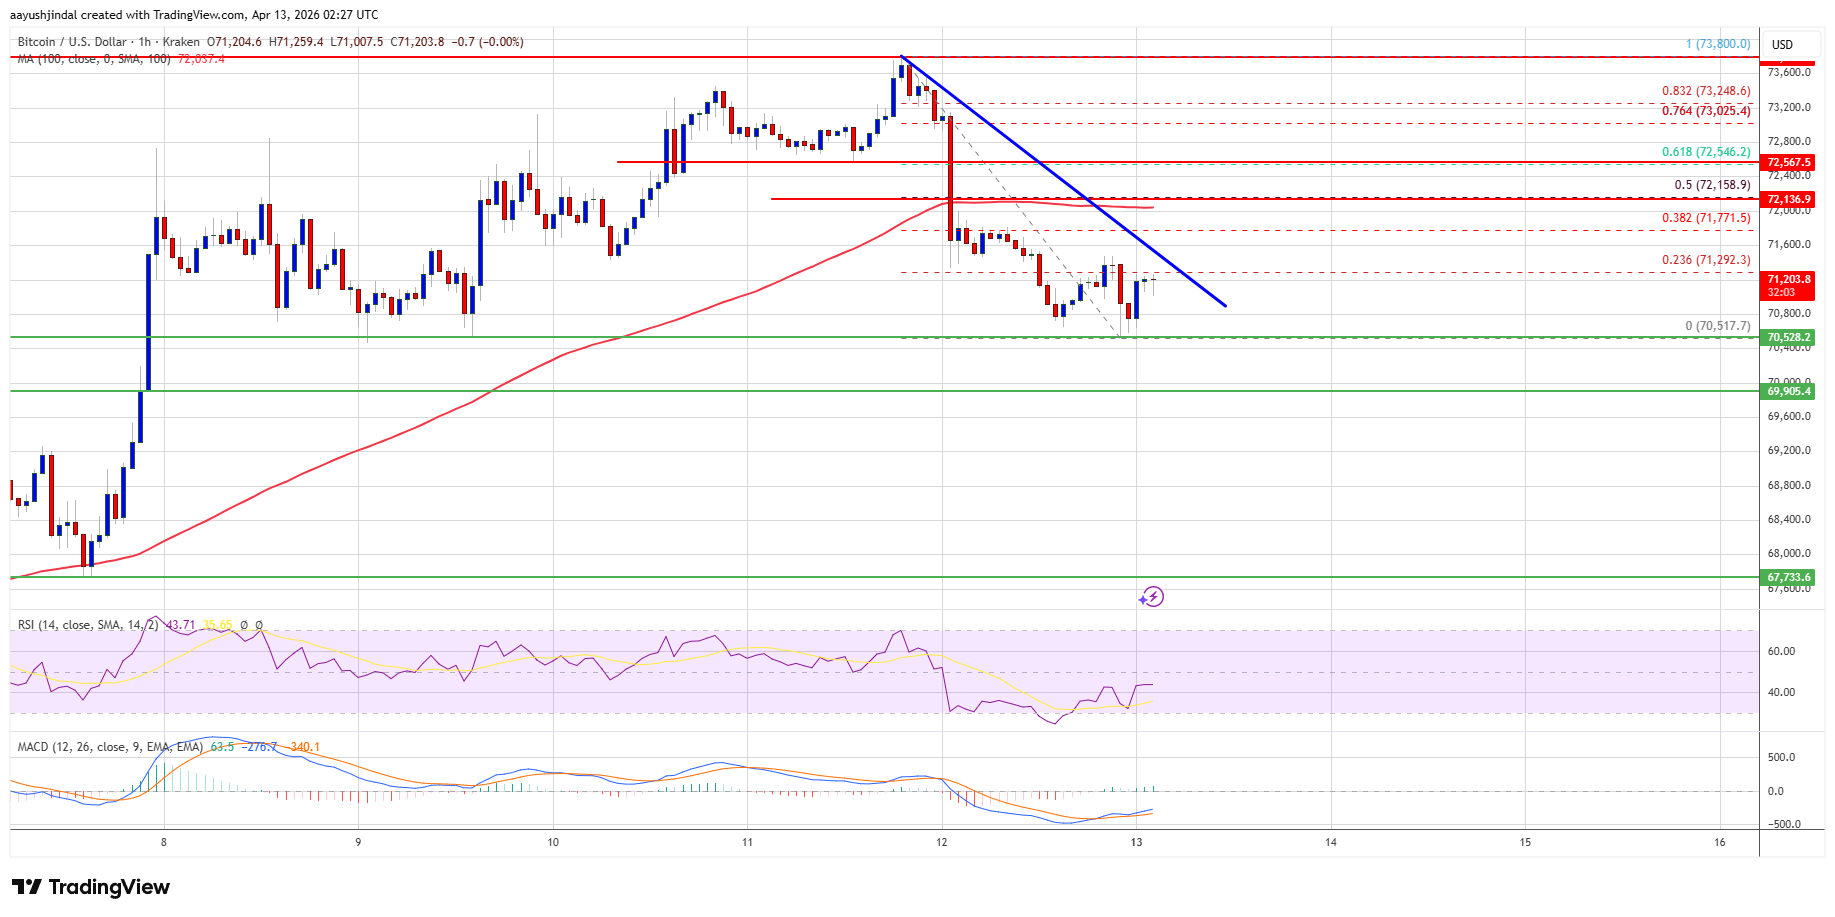
The price is trading below $72,000 and the 100 hourly simple moving average.
There is a connecting bearish trend line forming with resistance at $71,450 on the hourly chart of the BTC/USD pair (data feed from Kraken).
The pair might extend losses if it stays below the $71,500 and $72,000 levels.
Bitcoin price failed to stay above the $72,500 resistance zone. BTC formed a top near $73,800 and started a fresh decline. There was a move below the $72,500 level.
The price dipped below the $71,500 and $71,200 levels. A low was formed at $70,517, and the price is now consolidating losses below the 23.6% Fib retracement level of the downward move from the $73,800 swing high to the $70,517 low.
Bitcoin is now trading below $72,000 and the 100 hourly simple moving average. If the price remains stable above $70,500, it could attempt a fresh increase. Immediate resistance is near the $71,500 level. There is also a connecting bearish trend line forming with resistance at $71,450 on the hourly chart of the BTC/USD pair.
The first key resistance is near the $72,000 level. A close above the $72,000 resistance might send the price further higher. In the stated case, the price could rise and test the $72,500 resistance. Any more gains might send the price toward the $73,200 level. The next barrier for the bulls could be $74,000.
If Bitcoin fails to rise above the $72,000 resistance zone, it could start another decline. Immediate support is near the $70,800 level.
The first major support is near the $70,500 level. The next support is now near the $70,000 zone. Any more losses might send the price toward the $69,200 support in the near term. The main support now sits at $68,800, below which BTC might struggle to recover in the near term.
Technical indicators:
Hourly MACD – The MACD is now gaining pace in the bearish zone.
Hourly RSI (Relative Strength Index) – The RSI for BTC/USD is now below the 50 level.
Major Support Levels – $70,500, followed by $70,000.
Major Resistance Levels – $71,500 and $72,000.
[#item_full_content]NewsBTCRead MoreAccording to market analyst Darkfost, Bitcoin’s price-based supply distribution is revealing critical zones that could…
Jurrien Timmer, director of global macro at Fidelity Investments, says strong earnings are helping markets…
The current price range of Bitcoin may not relay much, but a change in ownership…
Key factors, such as ETF flows, macro factors and on-chain supply favor a rally in…
"Effective immediately, the United States Navy ... will begin the process of blockading any and…
Bitcoin traded as high as $73,000 following a 9% price rally in the past week.…