Bitcoin price is gaining pace and trading above the $44,000 resistance. BTC could continue to rise once it clears the $44,500 and $45,000 resistance levels.
Bitcoin started a decent increase above the $43,500 resistance zone.
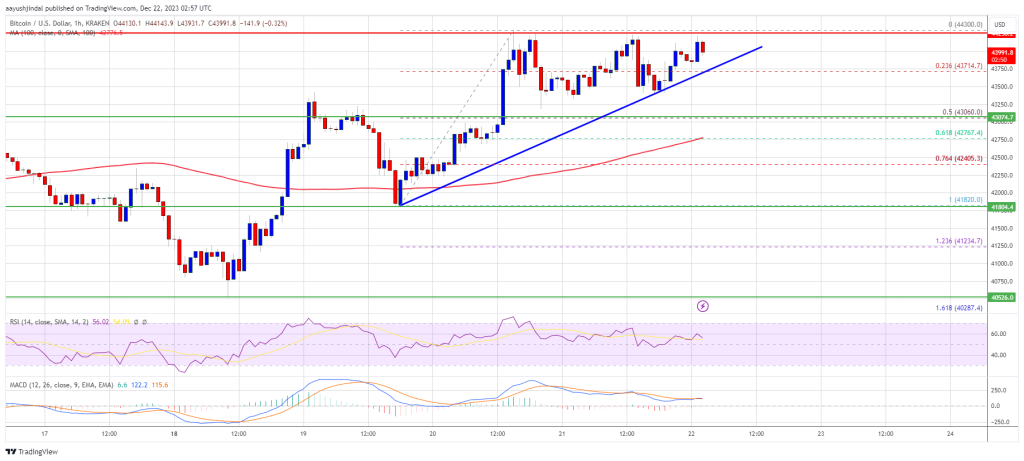
The price is trading above $43,500 and the 100 hourly Simple moving average.
There is a key bullish trend line forming with support near $43,800 on the hourly chart of the BTC/USD pair (data feed from Kraken).
The pair could start a strong rally if there is a close above $44,300 and $44,500.
Bitcoin price settled above the $43,500 resistance zone to move further into a bullish zone. BTC broke many hurdles and even spiked above the $44,000 level.
It tested the $44,300 resistance zone. A high was formed near $44,300 and the price is now consolidating gains. The price corrected a few points below the $44,100 level. However, it is stable above the 23.6% Fib retracement level of the upward move from the $41,820 swing low to the $44,300 high.
Bitcoin is now trading above $43,500 and the 100 hourly Simple moving average. There is also a key bullish trend line forming with support near $43,800 on the hourly chart of the BTC/USD pair.
On the upside, immediate resistance is near the $44,200 level. The first major resistance is forming near $44,300 and $44,500. A close above the $44,500 resistance could start a strong rally and the price could even clear the $45,000 resistance.
Source: BTCUSD on TradingView.com
The next key resistance could be near $46,500, above which BTC could rise toward the $47,200 level. Any more gains might send the price toward $48,000.
If Bitcoin fails to rise above the $44,300 resistance zone, it could start a fresh decline. Immediate support on the downside is near the $43,800 level and the trend line.
The next major support is near $42,750 or the 61.8% Fib retracement level of the upward move from the $41,820 swing low to the $44,300 high. If there is a move below $42,750, there is a risk of more losses. In the stated case, the price could drop toward the $42,200 support in the near term.
Technical indicators:
Hourly MACD – The MACD is now gaining pace in the bullish zone.
Hourly RSI (Relative Strength Index) – The RSI for BTC/USD is now above the 50 level.
Major Support Levels – $43,800, followed by $42,750.
Major Resistance Levels – $44,300, $44,500, and $45,000.
[#item_full_content]NewsBTCRead MoreThe headline number is useful, but the real story is what it says about positioning.…
Miners must redirect their hashrate before the July 31 cutoff, as the pool will stop…
The Nasdaq-listed Korean media company once lined up $1 billion in financing to buy 10,000…
The bank said Strategy's bitcoin sales policy adds avoidable market uncertainty and should be replaced…
Bitcoin Magazine Metaplanet Adds 2,823 Bitcoin, Reaches 43,000 BTC and Becomes World’s Third-Largest Corporate Treasury…
Bitcoin and major cryptocurrencies rebounded on dovish Federal Reserve signals, with speculative tokens like Memecore’s…