Bitcoin price recovered and climbed above the $64,000 resistance zone. BTC is now facing hurdles near the $65,500 and $66,000 levels.
Bitcoin is now struggling to gain pace for a move above the $65,500 resistance zone.
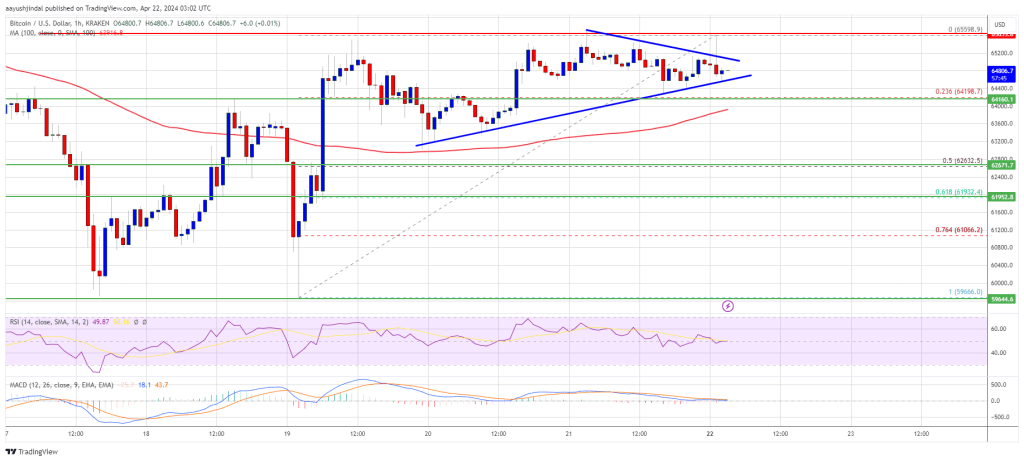
The price is trading above $64,000 and the 100 hourly Simple moving average.
There is a key contracting triangle forming with resistance at $65,100 on the hourly chart of the BTC/USD pair (data feed from Kraken).
The pair could start a fresh surge if it clears the $65,500 resistance zone.
Bitcoin price found support above $60,000 and started a fresh increase. BTC climbed above the $62,500 and $63,500 resistance levels. The bulls even pushed the price above the $65,000 level.
However, the bears seem to be active near the $65,500 zone. The recent high was formed at $65,598 and the price is now consolidating gains. There was a drop below the $65,000 level, but the price is still above the 23.6% Fib retracement level of the upward move from the $59,666 swing low to the $65,598 low.
Bitcoin price is trading above $64,000 and the 100 hourly Simple moving average. Immediate resistance is near the $65,100 level. There is also a key contracting triangle forming with resistance at $65,100 on the hourly chart of the BTC/USD pair.
The first major resistance could be $65,500. The next resistance now sits at $66,000. If there is a clear move above the $66,000 resistance zone, the price could continue to move up. In the stated case, the price could rise toward $67,500.
Source: BTCUSD on TradingView.com
The next major resistance is near the $68,500 zone. Any more gains might send Bitcoin toward the $70,000 resistance zone in the near term.
If Bitcoin fails to rise above the $65,500 resistance zone, it could start a downside correction. Immediate support on the downside is near the $64,500 level.
The first major support is $64,000. If there is a close below $64,000, the price could start to drop toward the 50% Fib retracement level of the upward move from the $59,666 swing low to the $65,598 low at $62,500. Any more losses might send the price toward the $61,200 support zone in the near term.
Technical indicators:
Hourly MACD – The MACD is now losing pace in the bullish zone.
Hourly RSI (Relative Strength Index) – The RSI for BTC/USD is now near the 50 level.
Major Support Levels – $64,500, followed by $64,000.
Major Resistance Levels – $65,100, $65,500, and $66,000.
[#item_full_content]NewsBTCRead MoreA potential US military strike on Iran’s main oil export terminal helped push Bitcoin to…
Bitcoin Magazine Bitcoin Price Surges Above $75,000 as Bullish Momentum Builds The bitcoin price climbed…
The alleged theft of 2,323 bitcoin has triggered a High Court dispute testing how English…
Bitcoin Magazine Bitcoin at Key Support Levels — Why Jack Mallers Says Turn On DCA…
Data shows the Bitcoin Fear & Greed Index has marked an improvement after the latest…
Bitcoin Magazine Eric Trump Confirmed As Speaker For Bitcoin 2026 Conference Bitcoin Magazine has confirmed…