Bitcoin price started a recovery wave above $69,200. BTC is now back above $70,000 and might aim for a steady increase if it clears $71,650.
Bitcoin started a decent recovery wave above $69,500 and $70,000.
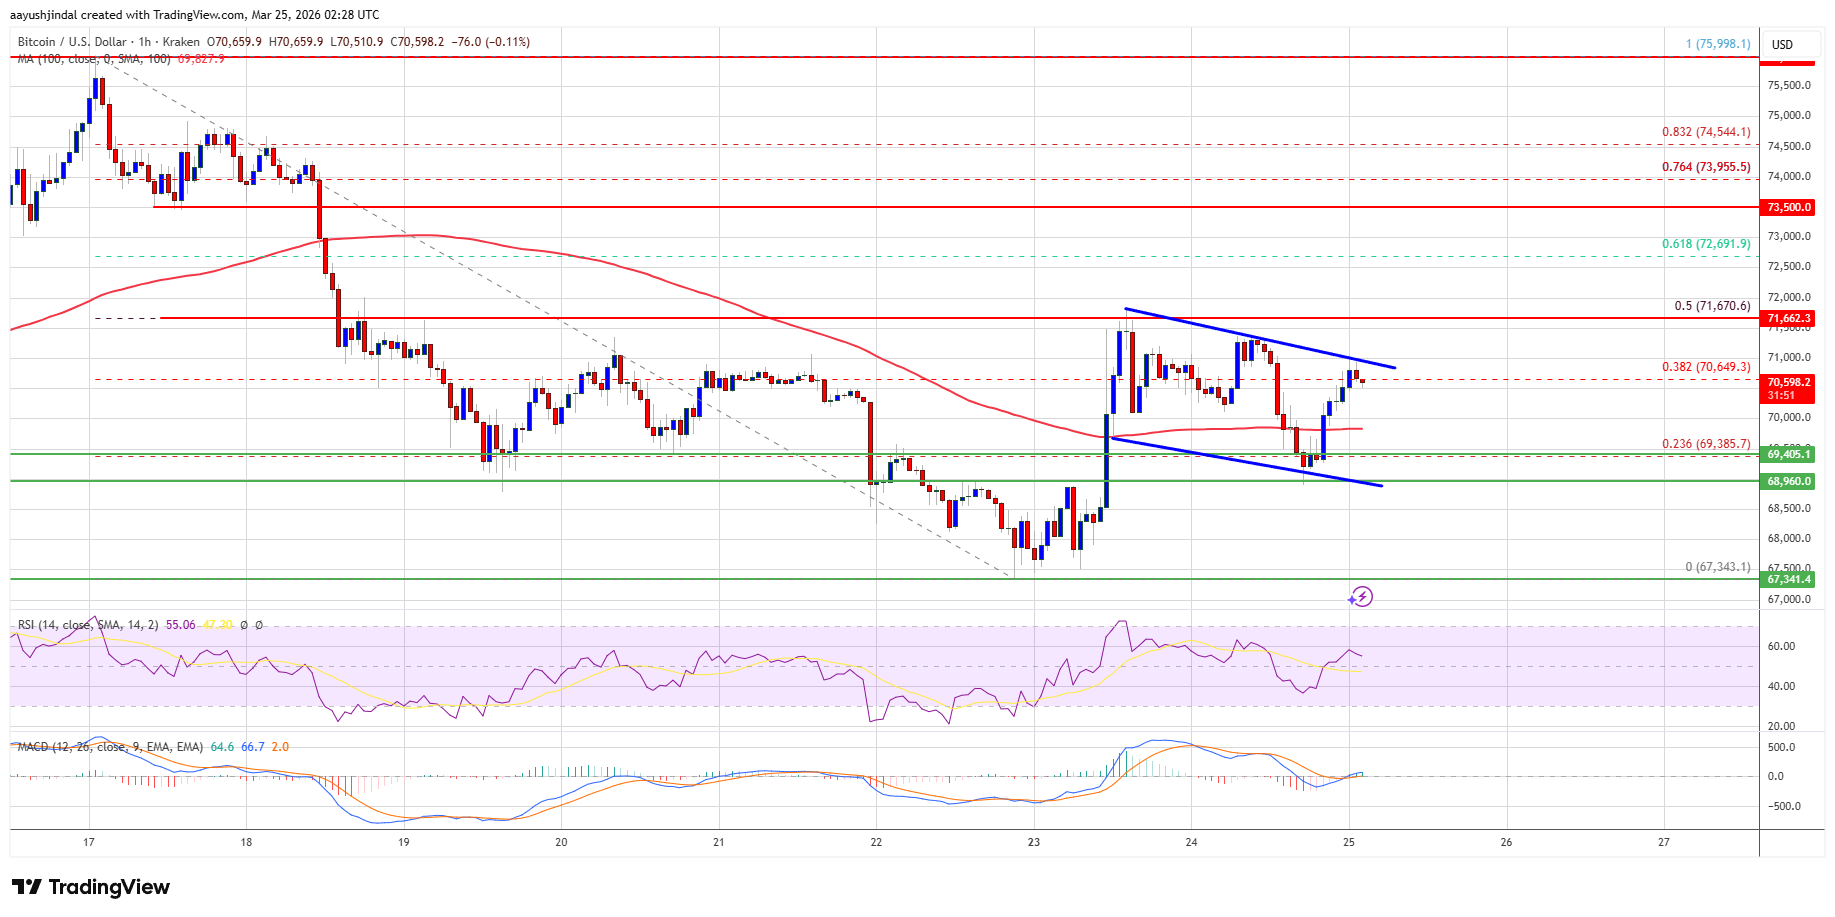
The price is trading above $70,000 and the 100 hourly simple moving average.
There is a bullish flag pattern forming with resistance at $70,700 on the hourly chart of the BTC/USD pair (data feed from Kraken).
The pair might start another decline if it stays below the $71,200 and $71,650 levels.
Bitcoin price started a recovery wave above the $68,800 pivot level. BTC climbed above the $69,200 and $69,500 resistance levels.
The bulls were able to push the price above the 38.2% Fib retracement level of the downward move from the $75,997 swing high to the $67,343 low. The price even climbed above $71,200 before the bears appeared near the $71,650 level.
Bitcoin is now trading above $70,000 and the 100 hourly simple moving average. If the price remains stable above $69,500, it could attempt a fresh increase. Immediate resistance is near the $70,700 level. There is also a bullish flag pattern forming with resistance at $70,700 on the hourly chart of the BTC/USD pair.
The first key resistance is near the $71,650 level or the 50% Fib retracement level of the downward move from the $75,997 swing high to the $67,343 low. A close above the $71,650 resistance might send the price further higher. In the stated case, the price could rise and test the $72,500 resistance. Any more gains might send the price toward the $73,200 level. The next barrier for the bulls could be $73,500.
If Bitcoin fails to rise above the $71,650 resistance zone, it could start another decline. Immediate support is near the $70,000 level. The first major support is near the $69,500 level.
The next support is now near the $69,000 zone. Any more losses might send the price toward the $68,200 support in the near term. The main support now sits at $67,500, below which BTC might struggle to recover in the near term.
Technical indicators:
Hourly MACD – The MACD is now losing pace in the bullish zone.
Hourly RSI (Relative Strength Index) – The RSI for BTC/USD is now above the 50 level.
Major Support Levels – $69,500, followed by $69,000.
Major Resistance Levels – $70,700 and $71,650.
[#item_full_content]NewsBTCRead MoreBrent crude slid nearly 12% on Monday to trade around $94, but market expert Sam…
Bitcoin Magazine U.S. Senator Cynthia Lummis Confirmed As A Bitcoin 2026 Speaker U.S. Senator Cynthia…
An Israeli TV report said a one-month ceasefire could be announced soon.Read MoreCoinDesk: Bitcoin, Ethereum,…
Bitcoin’s halving clock is ticking toward what analysts call a critical threshold — and the…
Bitcoin Magazine Morgan Stanley is Pushing Bitcoin and Crypto, But Says Wall Street Isn’t Chasing…
Bitcoin is trading above the $71,000 level as the market navigates heightened volatility, reflecting a…