Bitcoin price is again attempting an upside break above $68,000 resistance zone. BTC could rally if it clears $67,500 and $68,000 in the near term.
Bitcoin price started a decent increase above the $65,000 zone.
The price is trading below $65,000 and the 100 hourly Simple moving average.
There is a key bullish trend line forming with support at $65,900 on the hourly chart of the BTC/USD pair (data feed from Kraken).
The pair must clear the $68,000 resistance zone to start a fresh rally.
Bitcoin price remained supported above the $64,000 resistance zone. BTC climbed higher above the $66,500 and $66,000 resistance levels. However, the bears were active near the $67,500 and $68,000 levels.
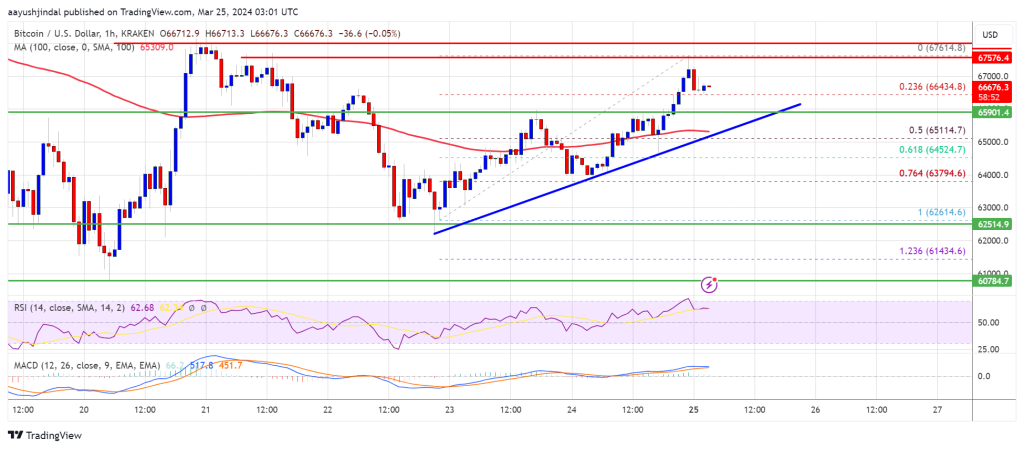
A high was formed near $67,614 and the price is now consolidating gains. It is trading near the 23.6% Fib retracement level of the upward move from the $62,614 swing low to the $67,614 high. Bitcoin is now trading above $65,000 and the 100 hourly Simple moving average.
There is also a key bullish trend line forming with support at $65,900 on the hourly chart of the BTC/USD pair. Immediate resistance is near the $67,500 level. The first major resistance could be $68,000.
Source: BTCUSD on TradingView.com
If there is a clear move above the $68,000 resistance zone, the price could continue to gain strength. In the stated case, the price could even clear the $69,0200 resistance zone in the near term. The next key resistance sits at $70,000.
If Bitcoin fails to rise above the $68,000 resistance zone, it could start another decline. Immediate support on the downside is near the $66,000 level and the trend line.
The first major support is $65,200 or the 50% Fib retracement level of the upward move from the $62,614 swing low to the $67,614 high. The next support sits at $63,800. If there is a close below $63,800, the price could start a drop toward the $61,200 level. Any more losses might send the price toward the $60,500 support zone in the near term.
Technical indicators:
Hourly MACD – The MACD is now losing pace in the bullish zone.
Hourly RSI (Relative Strength Index) – The RSI for BTC/USD is now above the 60 level.
Major Support Levels – $65,900, followed by $63,800.
Major Resistance Levels – $67,500, $68,000, and $69,200.
[#item_full_content]NewsBTCRead MoreBitcoin Magazine Bitwise Sees a Bottom in Bitcoin’s Worst Vibes Yet: ‘Darkest Before the Dawn’ …
Strategy now has more than 20 months of coverage for preferred-stock dividends and debt interest.Read…
Analysts point to bitcoin’s resilience amid fresh U.S.-Iran escalation and renewed spot ETF inflows as…
Bitcoin’s move back toward the $64,000 area gives bulls something to work with, but it…
Bitcoin Magazine Strategy (MSTR) Raises $467 Million in Cash, Leaves Stash of 843,775 Bitcoin Untouched…
Bitcoin Magazine Strive (ASST) Adds 18 Bitcoin, Pushing Treasury to 19,900 BTC Strive, Inc. (Nasdaq:…