Bitcoin price is again attempting an upside break above $68,000 resistance zone. BTC could rally if it clears $67,500 and $68,000 in the near term.
Bitcoin price started a decent increase above the $65,000 zone.
The price is trading below $65,000 and the 100 hourly Simple moving average.
There is a key bullish trend line forming with support at $65,900 on the hourly chart of the BTC/USD pair (data feed from Kraken).
The pair must clear the $68,000 resistance zone to start a fresh rally.
Bitcoin price remained supported above the $64,000 resistance zone. BTC climbed higher above the $66,500 and $66,000 resistance levels. However, the bears were active near the $67,500 and $68,000 levels.
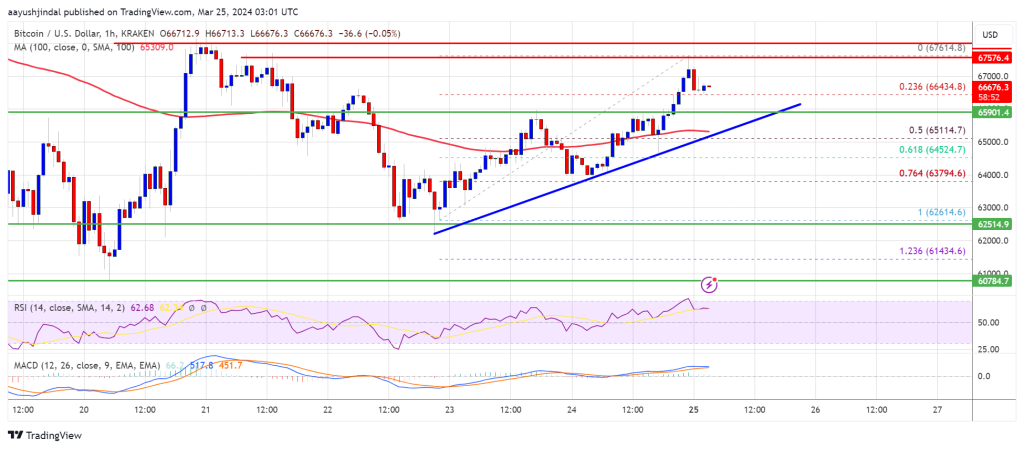
A high was formed near $67,614 and the price is now consolidating gains. It is trading near the 23.6% Fib retracement level of the upward move from the $62,614 swing low to the $67,614 high. Bitcoin is now trading above $65,000 and the 100 hourly Simple moving average.
There is also a key bullish trend line forming with support at $65,900 on the hourly chart of the BTC/USD pair. Immediate resistance is near the $67,500 level. The first major resistance could be $68,000.
Source: BTCUSD on TradingView.com
If there is a clear move above the $68,000 resistance zone, the price could continue to gain strength. In the stated case, the price could even clear the $69,0200 resistance zone in the near term. The next key resistance sits at $70,000.
If Bitcoin fails to rise above the $68,000 resistance zone, it could start another decline. Immediate support on the downside is near the $66,000 level and the trend line.
The first major support is $65,200 or the 50% Fib retracement level of the upward move from the $62,614 swing low to the $67,614 high. The next support sits at $63,800. If there is a close below $63,800, the price could start a drop toward the $61,200 level. Any more losses might send the price toward the $60,500 support zone in the near term.
Technical indicators:
Hourly MACD – The MACD is now losing pace in the bullish zone.
Hourly RSI (Relative Strength Index) – The RSI for BTC/USD is now above the 60 level.
Major Support Levels – $65,900, followed by $63,800.
Major Resistance Levels – $67,500, $68,000, and $69,200.
[#item_full_content]NewsBTCRead MoreBitcoin's correlation with global central bank easing has turned strongly negative since 2024, suggesting BTC…
Social sentiment, on-chain data, and positioning metrics all hit extremes not seen since late February,…
Bitcoin is entering the new week under a cloud of doubt, with social sentiment tilting…
The Bitcoin bear market is now six months in and showing no signs of letting…
Prominent market analyst with the pseudonym RugaResearch has drawn attention to recent developments with Bitcoin…
Developers are considering ways to quantum-proof the world's oldest cryptocurrency as the threat of this…