Bitcoin price is struggling to rise above the $52,000 resistance. BTC is now at risk of a downside break below the $50,500 support zone.
Bitcoin price is struggling to clear the $52,000 resistance zone.
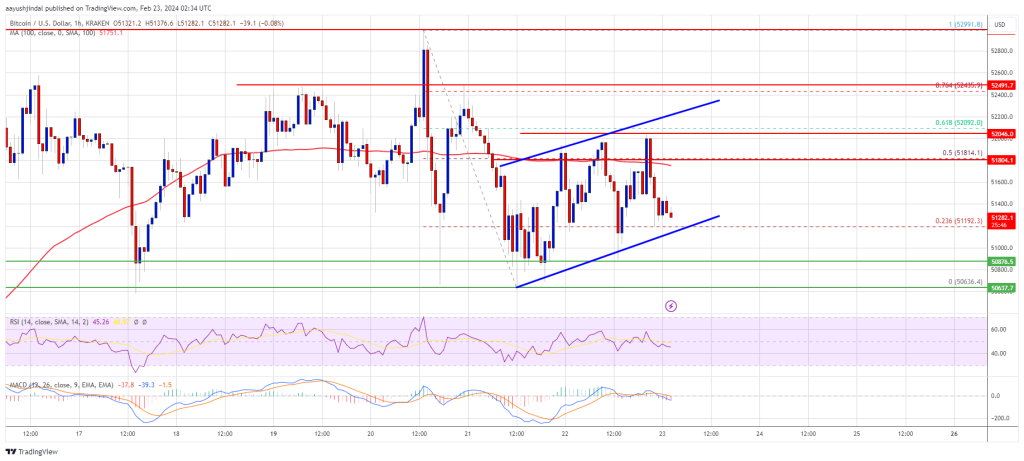
The price is trading below $51,800 and the 100 hourly Simple moving average.
There is a bearish flag forming with support at $51,120 on the hourly chart of the BTC/USD pair (data feed from Kraken).
The pair could start a major pullback if there is a move below the $50,500 support.
Bitcoin price remained in a short-term negative zone below the $52,200 resistance zone. BTC settled below $51,800 and slowly moved lower. There was a drop below the $51,200 level before there was a minor recovery.
The price recovered a few points above the $51,500 level. There was a move above the 50% Fib retracement level of the downward wave from the $52,990 swing high to the $50,636 low. However, the bears were active near the $52,000 resistance zone.
Bitcoin is now trading below $51,800 and the 100 hourly Simple moving average. There is also a bearish flag forming with support at $51,120 on the hourly chart of the BTC/USD pair.
Immediate resistance is near the $51,800 level. The next key resistance could be $52,000, above which the price could rise toward the $52,500 resistance zone. It is near the 76.4% Fib retracement level of the downward wave from the $52,990 swing high to the $50,636 low.
Source: BTCUSD on TradingView.com
The main resistance is now near the $53,000 level. A clear move above the $53,000 resistance could send the price toward the $53,500 resistance. The next resistance could be near the $54,200 level.
If Bitcoin fails to rise above the $51,800 resistance zone, it could start another decline in the near term. Immediate support on the downside is near the $51,100 level and the channel trend line.
The first major support is $50,550. If there is a close below $50,550, the price could start a decent pullback. In the stated case, the price could decline toward the $49,500 support zone, below which the price might even test $49,200.
Technical indicators:
Hourly MACD – The MACD is now gaining pace in the bearish zone.
Hourly RSI (Relative Strength Index) – The RSI for BTC/USD is now below the 50 level.
Major Support Levels – $51,100, followed by $50,550.
Major Resistance Levels – $51,800, $52,000, and $52,500.
[#item_full_content]NewsBTCRead MoreBitcoin continues to trade within a tight range, but beneath the surface, structural weakness is…
The World Liberty Forum held this week at Mar‑a‑Lago featured remarks from President Donald Trump’s…
Bitcoin Magazine Ledn Sells $188M Bitcoin-Backed Bonds in First-of-Its-Kind Deal Crypto lender Ledn Inc. has…
Bitcoin is now on track for its fifth consecutive weekly decline, and losing this level…
Bitcoin Magazine FutureBit launches Apollo III, U.S.-Engineered Home Bitcoin Miner FutureBit launched the Apollo III…
An analyst has highlighted how the Bitcoin Inter-exchange Flow Pulse has continued to be in…