Bitcoin price found support near $89,250. BTC is now correcting some losses but faces many hurdles near $93,500 and $94,200.
Bitcoin started a fresh decline below $94,000 and $93,500.
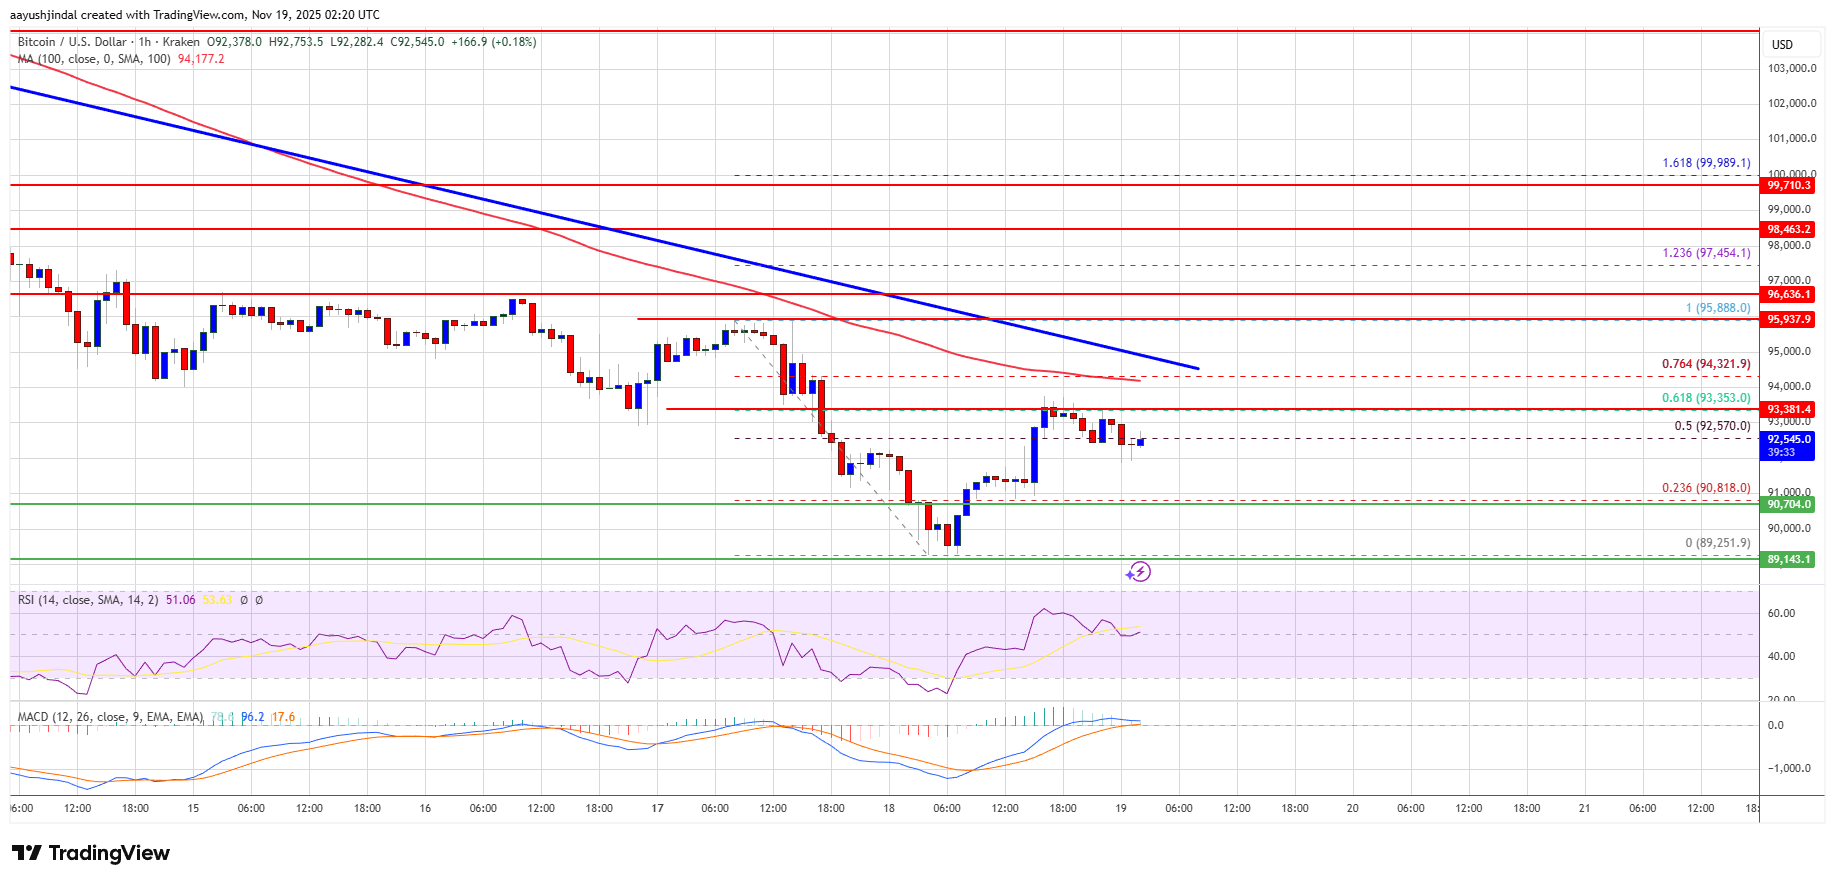
The price is trading below $93,000 and the 100 hourly Simple moving average.
There is a bearish trend line forming with resistance at $94,200 on the hourly chart of the BTC/USD pair (data feed from Kraken).
The pair might continue to move down if it settles below the $90,700 zone.
Bitcoin price failed to stay in a positive zone above the $92,500 level. BTC bears remained active below $92,500 and pushed the price lower.
The bears gained strength and were able to push the price below the $90,000 zone. A low was formed at $89,252, and the price is now attempting a recovery wave. There was a move above the 50% Fib retracement level of the recent decline from the $95,888 swing high to the $89,252 low.
Bitcoin is now trading below $94,000 and the 100 hourly Simple moving average. Besides, there is a bearish trend line forming with resistance at $94,200 on the hourly chart of the BTC/USD pair.
If the bulls attempt another recovery wave, the price could face resistance near the $93,350 level and the 61.8% Fib retracement level of the recent decline from the $95,888 swing high to the $89,252 low. The first key resistance is near the $94,200 level and the trend line.
The next resistance could be $95,000. A close above the $95,000 resistance might send the price further higher. In the stated case, the price could rise and test the $95,500 resistance. Any more gains might send the price toward the $96,500 level. The next barrier for the bulls could be $96,800 and $97,000.
If Bitcoin fails to rise above the $94,200 resistance zone, it could start another decline. Immediate support is near the $91,500 level. The first major support is near the $90,700 level.
The next support is now near the $90,000 zone. Any more losses might send the price toward the $88,800 support in the near term. The main support sits at $86,500, below which BTC might accelerate lower in the near term.
Technical indicators:
Hourly MACD – The MACD is now losing pace in the bearish zone.
Hourly RSI (Relative Strength Index) – The RSI for BTC/USD is now above the 50 level.
Major Support Levels – $91,500, followed by $90,700.
Major Resistance Levels – $93,250 and $94,200.
[#item_full_content]NewsBTCRead MoreBitcoin has long been lumped in with precious metals as a hedge against a weakening…
TL;DR On-chain records in the supplied pack point to a trader opening high-leverage short exposure…
TL;DR Ripple CEO Brad Garlinghouse criticized Michael Saylor’s Bitcoin accumulation model, according to reports from…
TL;DR Ripple CEO Brad Garlinghouse criticized Michael Saylor’s Bitcoin accumulation model, according to reports from…
TL;DR The supplied setup highlights resistance near the $61,000 area and support/liquidation interest around $58,200.Bitcoin…
TL;DR Mysten Labs’ Hashi framework aims to bring native Bitcoin collateral into Sui DeFi without…