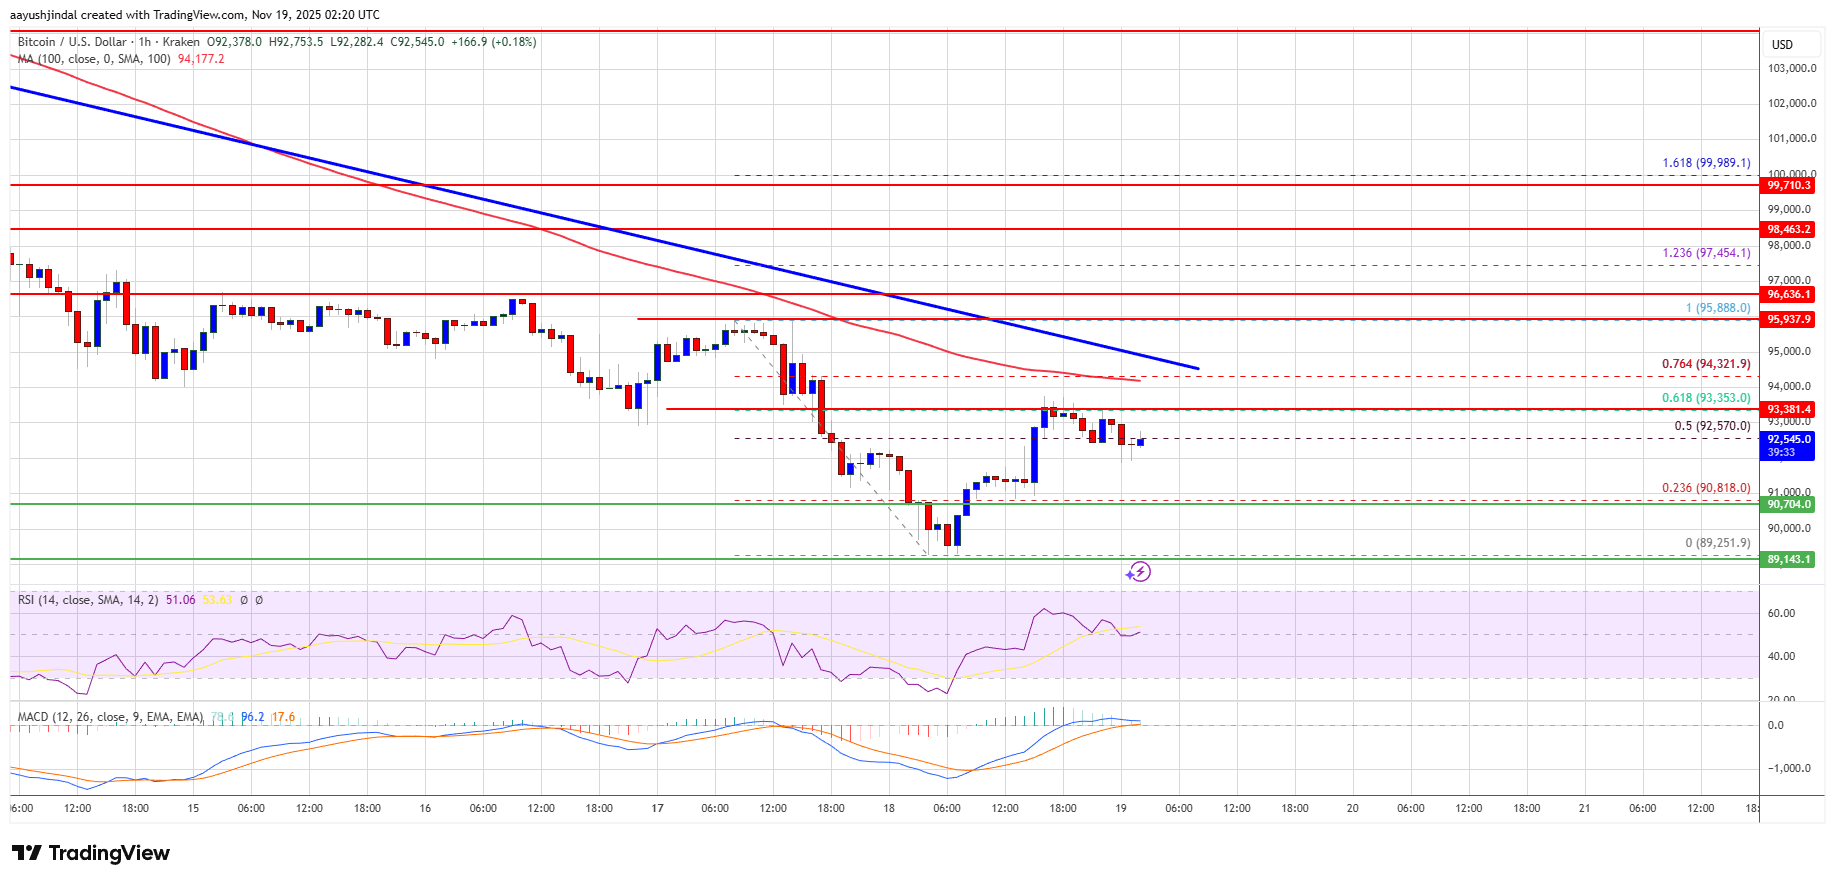
Bitcoin price found support near $89,250. BTC is now correcting some losses but faces many hurdles near $93,500 and $94,200.
Bitcoin started a fresh decline below $94,000 and $93,500.
The price is trading below $93,000 and the 100 hourly Simple moving average.
There is a bearish trend line forming with resistance at $94,200 on the hourly chart of the BTC/USD pair (data feed from Kraken).
The pair might continue to move down if it settles below the $90,700 zone.
Bitcoin price failed to stay in a positive zone above the $92,500 level. BTC bears remained active below $92,500 and pushed the price lower.
The bears gained strength and were able to push the price below the $90,000 zone. A low was formed at $89,252, and the price is now attempting a recovery wave. There was a move above the 50% Fib retracement level of the recent decline from the $95,888 swing high to the $89,252 low.
Bitcoin is now trading below $94,000 and the 100 hourly Simple moving average. Besides, there is a bearish trend line forming with resistance at $94,200 on the hourly chart of the BTC/USD pair.
If the bulls attempt another recovery wave, the price could face resistance near the $93,350 level and the 61.8% Fib retracement level of the recent decline from the $95,888 swing high to the $89,252 low. The first key resistance is near the $94,200 level and the trend line.
The next resistance could be $95,000. A close above the $95,000 resistance might send the price further higher. In the stated case, the price could rise and test the $95,500 resistance. Any more gains might send the price toward the $96,500 level. The next barrier for the bulls could be $96,800 and $97,000.
If Bitcoin fails to rise above the $94,200 resistance zone, it could start another decline. Immediate support is near the $91,500 level. The first major support is near the $90,700 level.
The next support is now near the $90,000 zone. Any more losses might send the price toward the $88,800 support in the near term. The main support sits at $86,500, below which BTC might accelerate lower in the near term.
Technical indicators:
Hourly MACD – The MACD is now losing pace in the bearish zone.
Hourly RSI (Relative Strength Index) – The RSI for BTC/USD is now above the 50 level.
Major Support Levels – $91,500, followed by $90,700.
Major Resistance Levels – $93,250 and $94,200.
[#item_full_content]NewsBTCRead MoreBitcoin’s extended pullback from its all-time high has left traders in uncertainty, and many investors…
Bitcoin recently pushed into a key liquidity pocket near the $73,000 level, briefly tapping overhead…
The price of Bitcoin put in another interesting performance over the past week, as the…
Strategy’s stock is trading below the value of its own Bitcoin holdings — an unusual…
The cryptocurrency community pushed back, with Michael Saylor saying Bitcoin has no issuer, promoter, or…
Crypto pundit Crypto Bully has shared his base case for Bitcoin and what to expect…