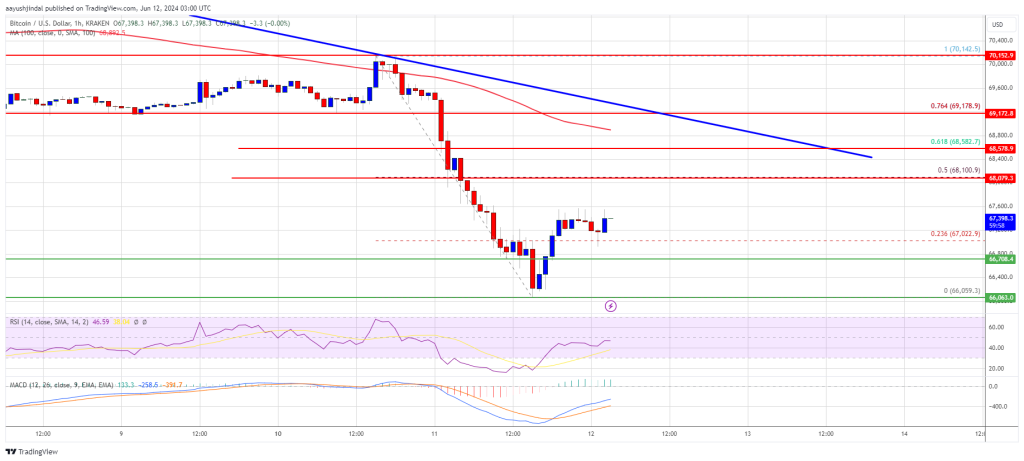
Bitcoin price extended losses below $67,500 support zone. BTC tested the $66,000 support zone and is now attempting a recovery wave.
Bitcoin started another decline below the $68,500 support zone.
The price is trading below $68,000 and the 100 hourly Simple moving average.
There is a connecting bearish trend line forming with resistance at $68,650 on the hourly chart of the BTC/USD pair (data feed from Kraken).
The pair could recover but the upsides might be limited above the $68,500 level.
Bitcoin price failed to start another increase above the $68,500 resistance zone. BTC reacted to the downside and traded below the $68,000 level. There was a drop below the $67,500 and $67,000 levels.
The price tested the $66,000 zone. A low was formed at $66,059 and the price is now consolidating losses above the 23.6% Fib retracement level of the downward move from the $70,143 swing high to the $66,059 low. Bitcoin is now trading below $68,500 and the 100 hourly Simple moving average.
On the upside, the price is facing resistance near the $67,600 level. The first major resistance could be $68,000 and the 50% Fib retracement level of the downward move from the $70,143 swing high to the $66,059 low.
The next key resistance could be $68,500. There is also a connecting bearish trend line forming with resistance at $68,650 on the hourly chart of the BTC/USD pair. The trend line is also close to the 100 hourly Simple moving average.
A clear move above the $68,500 resistance might send the price higher. In the stated case, the price could rise and test the $69,000 resistance. Any more gains might send BTC toward the $70,200 resistance in the near term.
If Bitcoin fails to climb above the $68,500 resistance zone, it could start another decline. Immediate support on the downside is near the $66,700 level.
The first major support is $66,200. The next support is now forming near $66,000. Any more losses might send the price toward the $65,500 support zone in the near term.
Technical indicators:
Hourly MACD – The MACD is now losing pace in the bearish zone.
Hourly RSI (Relative Strength Index) – The RSI for BTC/USD is now below the 50 level.
Major Support Levels – $66,700, followed by $66,000.
Major Resistance Levels – $68,000, and $68,500.
[#item_full_content]NewsBTCRead MoreBitcoin Magazine Strategy (MSTR) Pauses Bitcoin Buying and Spends $205 Million on Preferred Stock Strategy…
Bitcoin Magazine Bitcoin’s Bear Market Is Over, Galaxy Says Galaxy Research believes bitcoin’s bear market…
▶ Bitcoin Magazine Bitcoin Treasury Analyst: MSTR, ASST & Metaplanet Digital Credit Outlook Metaplanet couldn’t…
▶ Bitcoin Magazine PHP Hack: How Bitcoin Will Respond to the “Cyber Pandemic” Government websites…
▶ Bitcoin Magazine The Bitcoin vs. Nasdaq Signal Has Flipped Bullish Tech stocks are selling…
▶ Bitcoin Magazine Blockstream Executive Peter Bain: Institutional Clients Say Bitcoin “Poised for a Big…