Bitcoin price is correcting gains below $113,500. BTC could continue to move down if it stays below the $114,200 resistance.
Bitcoin started a downside correction below the $114,200 support.
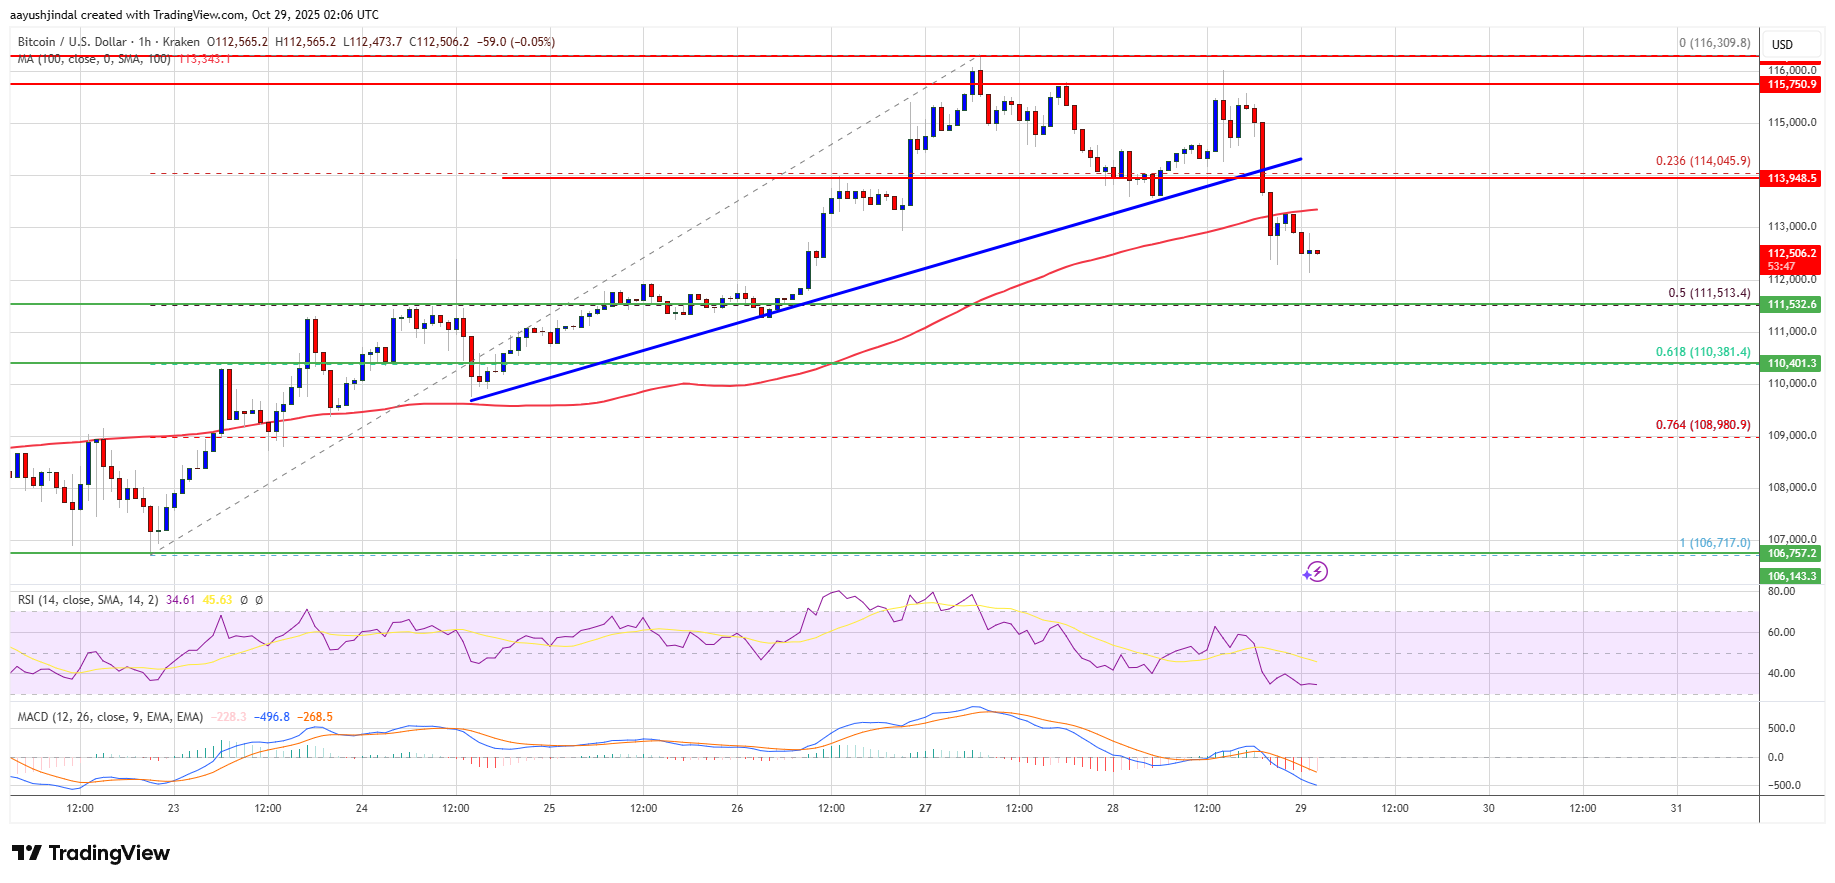
The price is trading below $114,000 and the 100 hourly Simple moving average.
There was a break below a bullish trend line with support at $114,050 on the hourly chart of the BTC/USD pair (data feed from Kraken).
The pair might continue to move down if it trades below the $112,000 zone.
Bitcoin price extended gains above the $113,500 zone. BTC gained pace for a move above the $115,000 pivot level. The price even spiked above $116,200 before the bears appeared.
A high was formed at $116,309 and the price is now correcting some gains. There was a move below the $114,200 support zone. The price dipped below the 23.6% Fib retracement level of the recent wave from the $106,718 swing low to the $116,309 high.
Moreover, there was a break below a bullish trend line with support at $114,050 on the hourly chart of the BTC/USD pair. Bitcoin is now trading below $114,000 and the 100 hourly Simple moving average.
Immediate resistance on the upside is near the $113,650 level. The first key resistance is near the $114,200 level. The next resistance could be $115,000. A close above the $115,000 resistance might send the price further higher. In the stated case, the price could rise and test the $116,200 resistance. Any more gains might send the price toward the $117,500 level. The next barrier for the bulls could be $118,000.
If Bitcoin fails to rise above the $114,200 resistance zone, it could continue to move down. Immediate support is near the $112,000 level. The first major support is near the $111,500 level or the 50% Fib retracement level of the recent wave from the $106,718 swing low to the $116,309 high.
The next support is now near the $110,500 zone. Any more losses might send the price toward the $110,000 support in the near term. The main support sits at $108,500, below which BTC might struggle to recover in the short term.
Technical indicators:
Hourly MACD – The MACD is now gaining pace in the bearish zone.
Hourly RSI (Relative Strength Index) – The RSI for BTC/USD is now below the 50 level.
Major Support Levels – $112,000, followed by $111,500.
Major Resistance Levels – $114,200 and $115,000.
[#item_full_content]NewsBTCRead MoreBitcoin is up 4.2% over seven days that contained an oil shock, a bond selloff…
A sharp rise in the yen has left bitcoin and other major cryptocurrencies underperforming in…
At its last stage for government approval, the state's executive council rejected the bond project…
Bitcoin Magazine JPMorgan Says the Real Threat to Bitcoin Isn’t Strategy (MSTR) — It’s Private…
Redemption requests in the $2 trillion private credit market surged to $15.6 billion in the…
Bitcoin Magazine Bitcoin’s New Debt Machine is Facing Its First Major Test Public companies kept…