Bitcoin price is correcting gains below $113,500. BTC could continue to move down if it stays below the $114,200 resistance.
Bitcoin started a downside correction below the $114,200 support.
The price is trading below $114,000 and the 100 hourly Simple moving average.
There was a break below a bullish trend line with support at $114,050 on the hourly chart of the BTC/USD pair (data feed from Kraken).
The pair might continue to move down if it trades below the $112,000 zone.
Bitcoin price extended gains above the $113,500 zone. BTC gained pace for a move above the $115,000 pivot level. The price even spiked above $116,200 before the bears appeared.
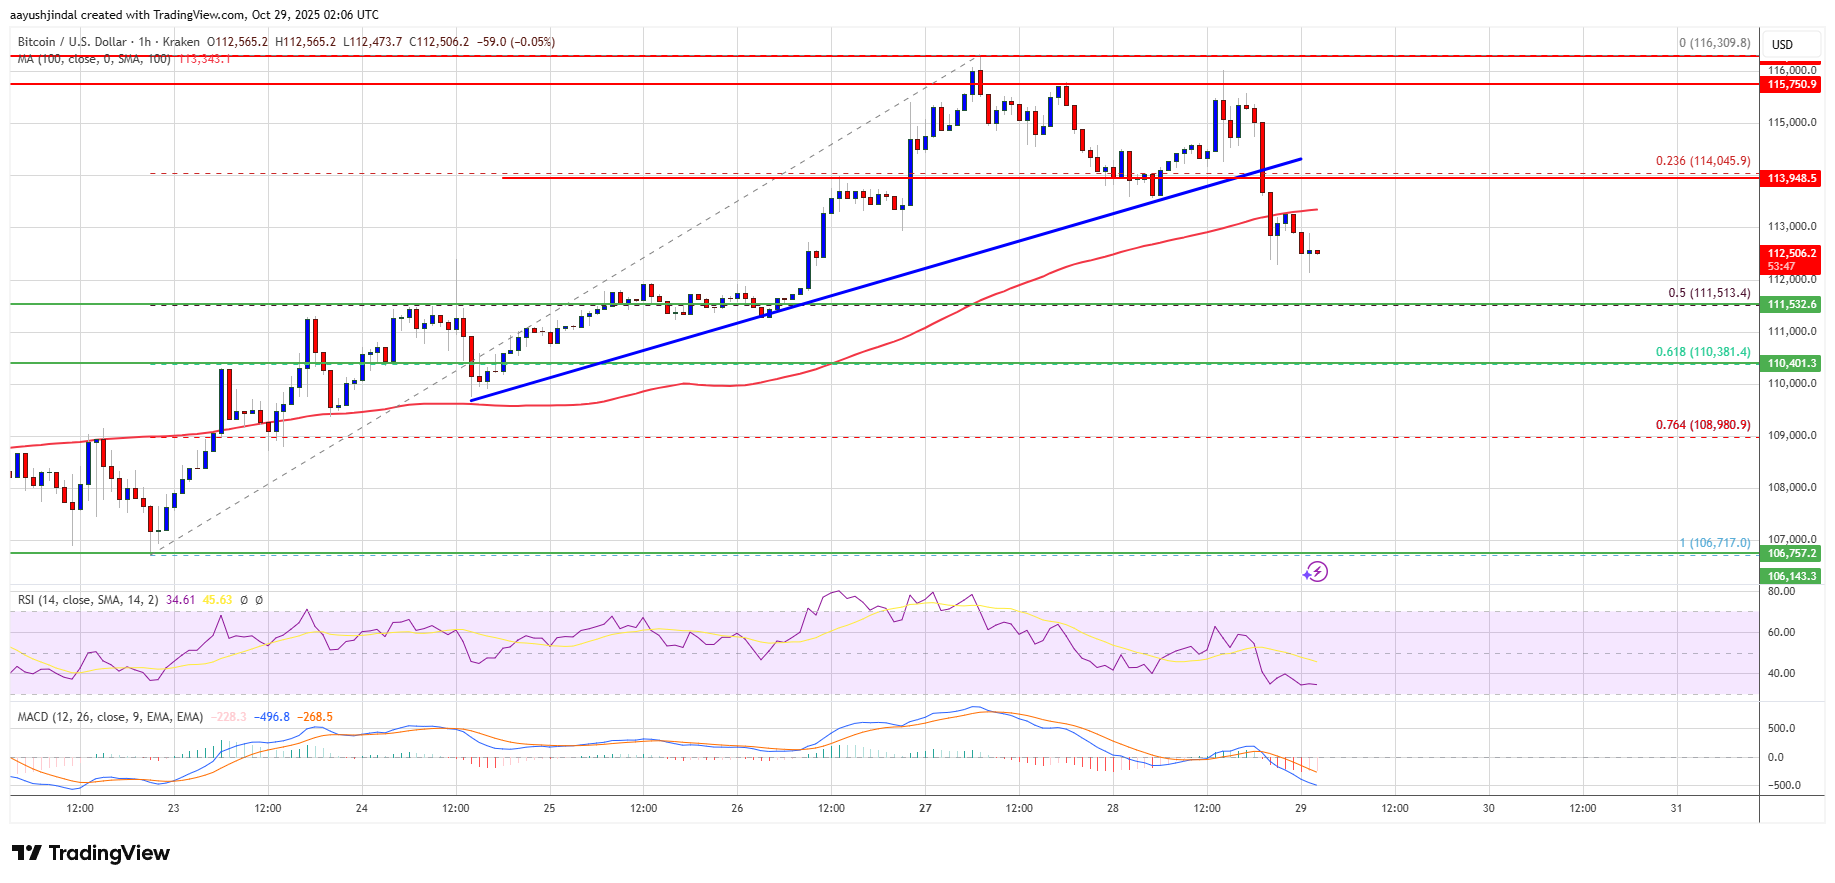
A high was formed at $116,309 and the price is now correcting some gains. There was a move below the $114,200 support zone. The price dipped below the 23.6% Fib retracement level of the recent wave from the $106,718 swing low to the $116,309 high.
Moreover, there was a break below a bullish trend line with support at $114,050 on the hourly chart of the BTC/USD pair. Bitcoin is now trading below $114,000 and the 100 hourly Simple moving average.
Immediate resistance on the upside is near the $113,650 level. The first key resistance is near the $114,200 level. The next resistance could be $115,000. A close above the $115,000 resistance might send the price further higher. In the stated case, the price could rise and test the $116,200 resistance. Any more gains might send the price toward the $117,500 level. The next barrier for the bulls could be $118,000.
If Bitcoin fails to rise above the $114,200 resistance zone, it could continue to move down. Immediate support is near the $112,000 level. The first major support is near the $111,500 level or the 50% Fib retracement level of the recent wave from the $106,718 swing low to the $116,309 high.
The next support is now near the $110,500 zone. Any more losses might send the price toward the $110,000 support in the near term. The main support sits at $108,500, below which BTC might struggle to recover in the short term.
Technical indicators:
Hourly MACD – The MACD is now gaining pace in the bearish zone.
Hourly RSI (Relative Strength Index) – The RSI for BTC/USD is now below the 50 level.
Major Support Levels – $112,000, followed by $111,500.
Major Resistance Levels – $114,200 and $115,000.
[#item_full_content]NewsBTCRead MoreA brutal crypto selloff erased $2.6 billion in leveraged bets, sent bitcoin to $60,000 and…
Your day-ahead look for Feb. 6, 2026Read MoreCoinDesk: Bitcoin, Ethereum, Crypto News and Price Data[#item_full_content]
Earnings disappointments weigh on AI related tech, while crypto sentiment improves on bitcoin’s rebound.Read MoreCoinDesk:…
Bitcoin’s role in big-money talks has shifted in recent weeks. Reports say analysts at JPMorgan…
What to Know: Metaplanet’s aggressive Bitcoin accumulation strategy confirms a growing trend of corporate treasury…
Bitcoin is on course to see five red months in a row, as it is…