Bitcoin price corrected losses and traded above the $114,200 level. BTC is now struggling and might face hurdles near the $116,000 level.
Bitcoin started a recovery wave above the $114,000 resistance level.
The price is trading below $115,000 and the 100 hourly Simple moving average.
There is a bearish trend line forming with resistance at $119,250 on the hourly chart of the BTC/USD pair (data feed from Kraken).
The pair might continue to move down if it trades below the $112,500 zone.
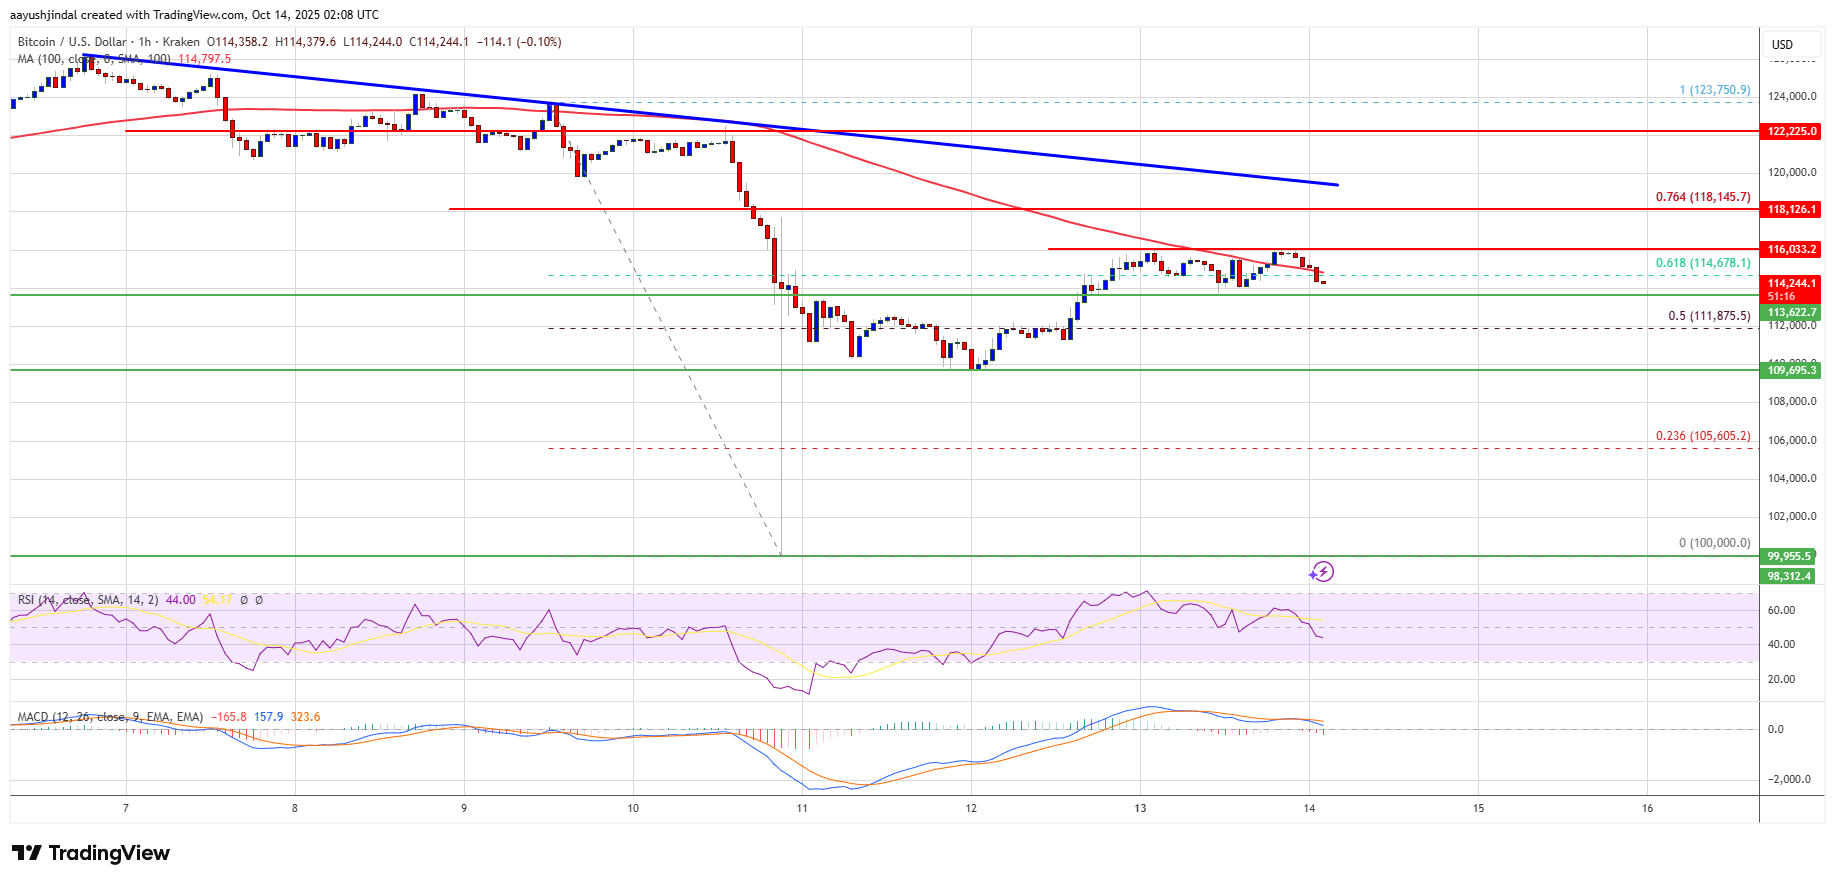
Bitcoin price started a recovery wave above the $110,000 pivot level. BTC recovered above the $112,500 and $113,200 resistance levels.
The price climbed above the 50% Fib retracement level of the main drop from the $123,750 swing high to the $100,000 low. The bulls even pushed the price above the $114,000 resistance level. However, there are many hurdles on the upside.
Bitcoin is now trading below $116,000 and the 100 hourly Simple moving average. Besides, there is a bearish trend line forming with resistance at $119,250 on the hourly chart of the BTC/USD pair.
Immediate resistance on the upside is near the $115,000 level. The first key resistance is near the $116,000 level. The next resistance could be $118,150 and the 76.4% Fib retracement level of the main drop from the $123,750 swing high to the $100,000 low.
A close above the $118,150 resistance might send the price further higher. In the stated case, the price could rise and test the $119,250 resistance and the trend line. Any more gains might send the price toward the $120,000 level. The next barrier for the bulls could be $122,500.
If Bitcoin fails to rise above the $115,000 resistance zone, it could start a fresh decline. Immediate support is near the $113,600 level. The first major support is near the $112,500 level.
The next support is now near the $111,200 zone. Any more losses might send the price toward the $110,500 support in the near term. The main support sits at $110,000, below which BTC might struggle to recover in the short term.
Technical indicators:
Hourly MACD – The MACD is now gaining pace in the bearish zone.
Hourly RSI (Relative Strength Index) – The RSI for BTC/USD is now below the 50 level.
Major Support Levels – $113,500, followed by $112,500.
Major Resistance Levels – $115,000 and $116,000.
[#item_full_content]NewsBTCRead MoreFirst-quarter purchases have reached 89,618 BTC so far, the most since fourth-quarter 2024, and the…
Bitcoin (BTC) is showing early signs of a prolonged decline after peaking in October 2025.…
According to a recent on-chain data evaluation, the Bitcoin price might not be seeing a…
The Bitcoin market remains subject to high uncertainty, with bearish sentiments at heightened levels. In…
For the first time in nearly two months, the Bitcoin price had a sustained run…
On-chain data shows the Bitcoin sharks and whales have seen their population grow during the…