Bitcoin price is gaining pace below $115,500. BTC is still showing bearish signs and remains at risk of more losses below the $112,000 zone.
Bitcoin started a fresh decline below the $116,500 zone.
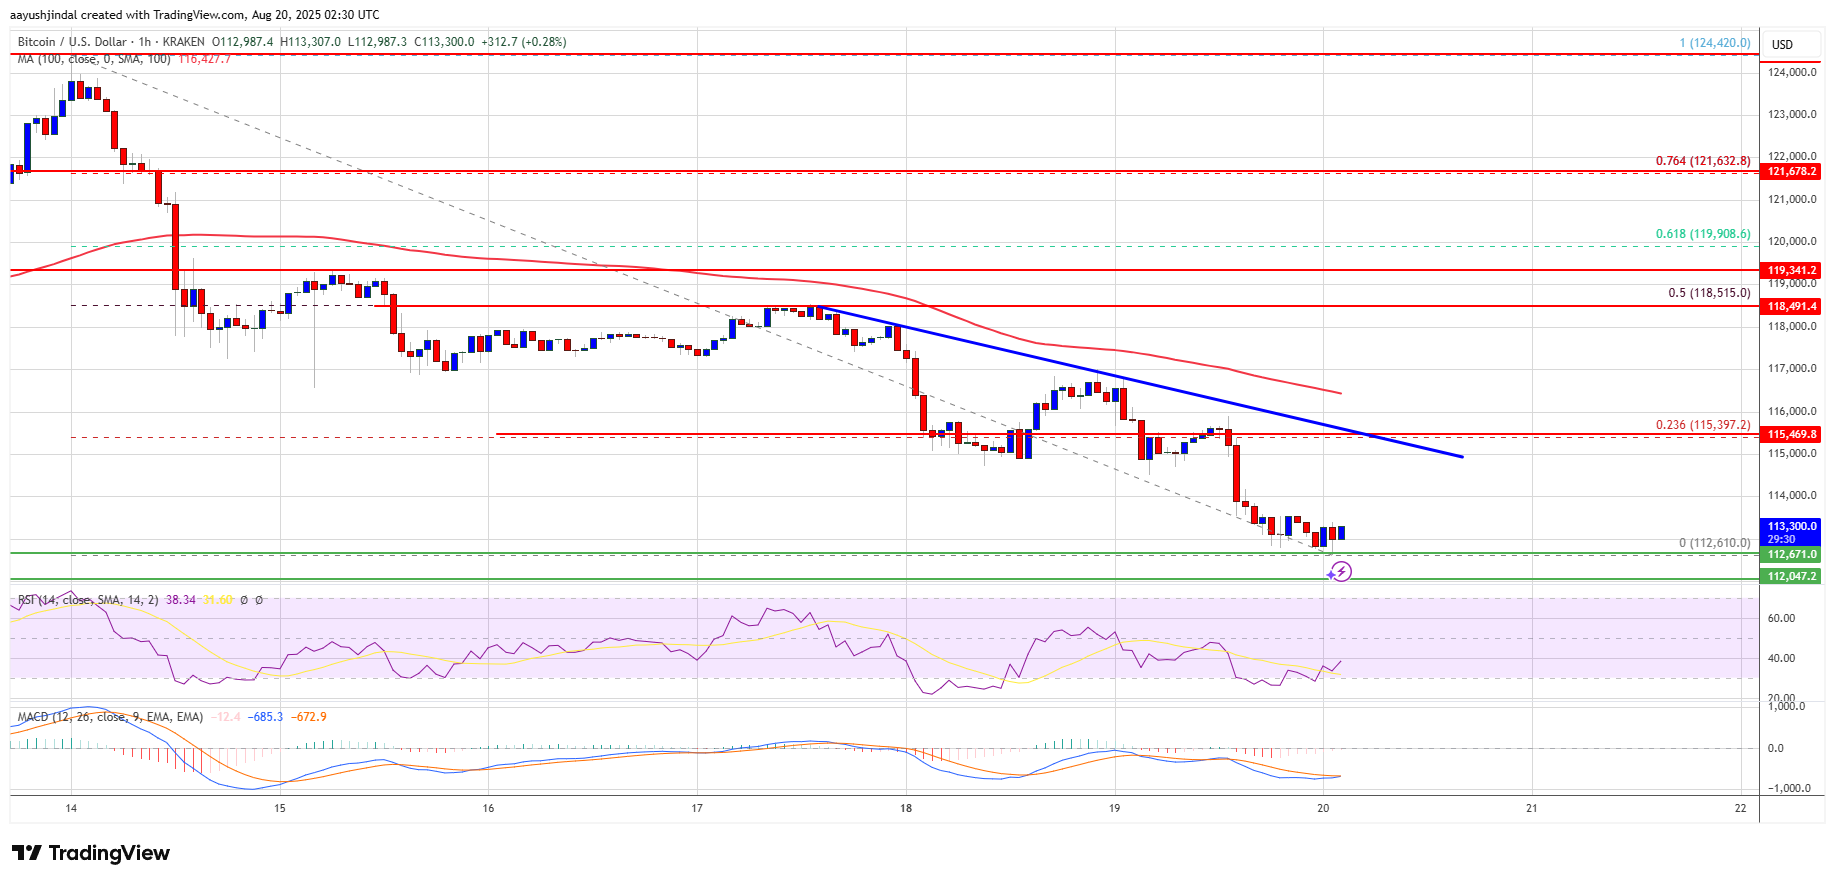
The price is trading below $115,500 and the 100 hourly Simple moving average.
There is a key bearish trend line forming with resistance at $115,400 on the hourly chart of the BTC/USD pair (data feed from Kraken).
The pair might start another increase if it clears the $115,500 resistance zone.
Bitcoin price started a fresh decline after a close below the $118,000 level. BTC gained bearish momentum and traded below the $116,500 support zone.
There was a move below the $115,500 support zone and the 100 hourly Simple moving average. The pair tested the $112,500 zone. A low was formed at $112,610 and the price is now consolidating below the 23.6% Fib retracement level of the recent decline from the $124,420 swing high to the $112,610 low.
Bitcoin is now trading below $116,000 and the 100 hourly Simple moving average. Immediate resistance on the upside is near the $114,200 level. The first key resistance is near the $115,000 level. There is also a key bearish trend line forming with resistance at $115,400 on the hourly chart of the BTC/USD pair.
The next resistance could be $115,500. A close above the $115,500 resistance might send the price further higher. In the stated case, the price could rise and test the $118,500 resistance level. It is close to the 50% Fib retracement level of the recent decline from the $124,420 swing high to the $112,610 low. Any more gains might send the price toward the $120,000 level. The main target could be $121,500.
If Bitcoin fails to rise above the $115,000 resistance zone, it could start a fresh decline. Immediate support is near the $112,500 level. The first major support is near the $112,000 level.
The next support is now near the $110,500 zone. Any more losses might send the price toward the $110,000 support in the near term. The main support sits at $108,000, below which BTC might take a major hit.
Technical indicators:
Hourly MACD – The MACD is now gaining pace in the bearish zone.
Hourly RSI (Relative Strength Index) – The RSI for BTC/USD is now below the 50 level.
Major Support Levels – $112,500, followed by $110,500.
Major Resistance Levels – $115,000 and $115,500.
[#item_full_content]NewsBTCRead MoreBitcoin price started a recovery wave above $68,500. BTC is now struggling to clear $72,000…
Bitcoin’s latest drawdown from its all-time high is being compared to 2022 across crypto Twitter…
Scaramucci noted that SkyBridge has been purchasing bitcoin at various price points, including around $84,000,…
Bitcoin’s mining landscape is showing clear signs of stress as network difficulty records its largest…
The Bitcoin and Ethereum prices have rebounded from last week’s lows, providing optimism that the…
Bitcoin is tightening between two major liquidity pools, with both bulls and bears sitting on…