Bitcoin price failed to recover above $105,000. BTC is trimming gains and might could continue to move down if it trades below $101,200.
Bitcoin started a fresh decline after it failed to clear $105,500.
The price is trading below $105,000 and the 100 hourly Simple moving average.
There is a bearish trend line forming with resistance at $103,300 on the hourly chart of the BTC/USD pair (data feed from Kraken).
The pair might continue to move down if it settles below the $101,200 zone.
Bitcoin price failed to stay in a positive zone above the $105,500 pivot level. BTC bears remained active below $105,500 and pushed the price lower.
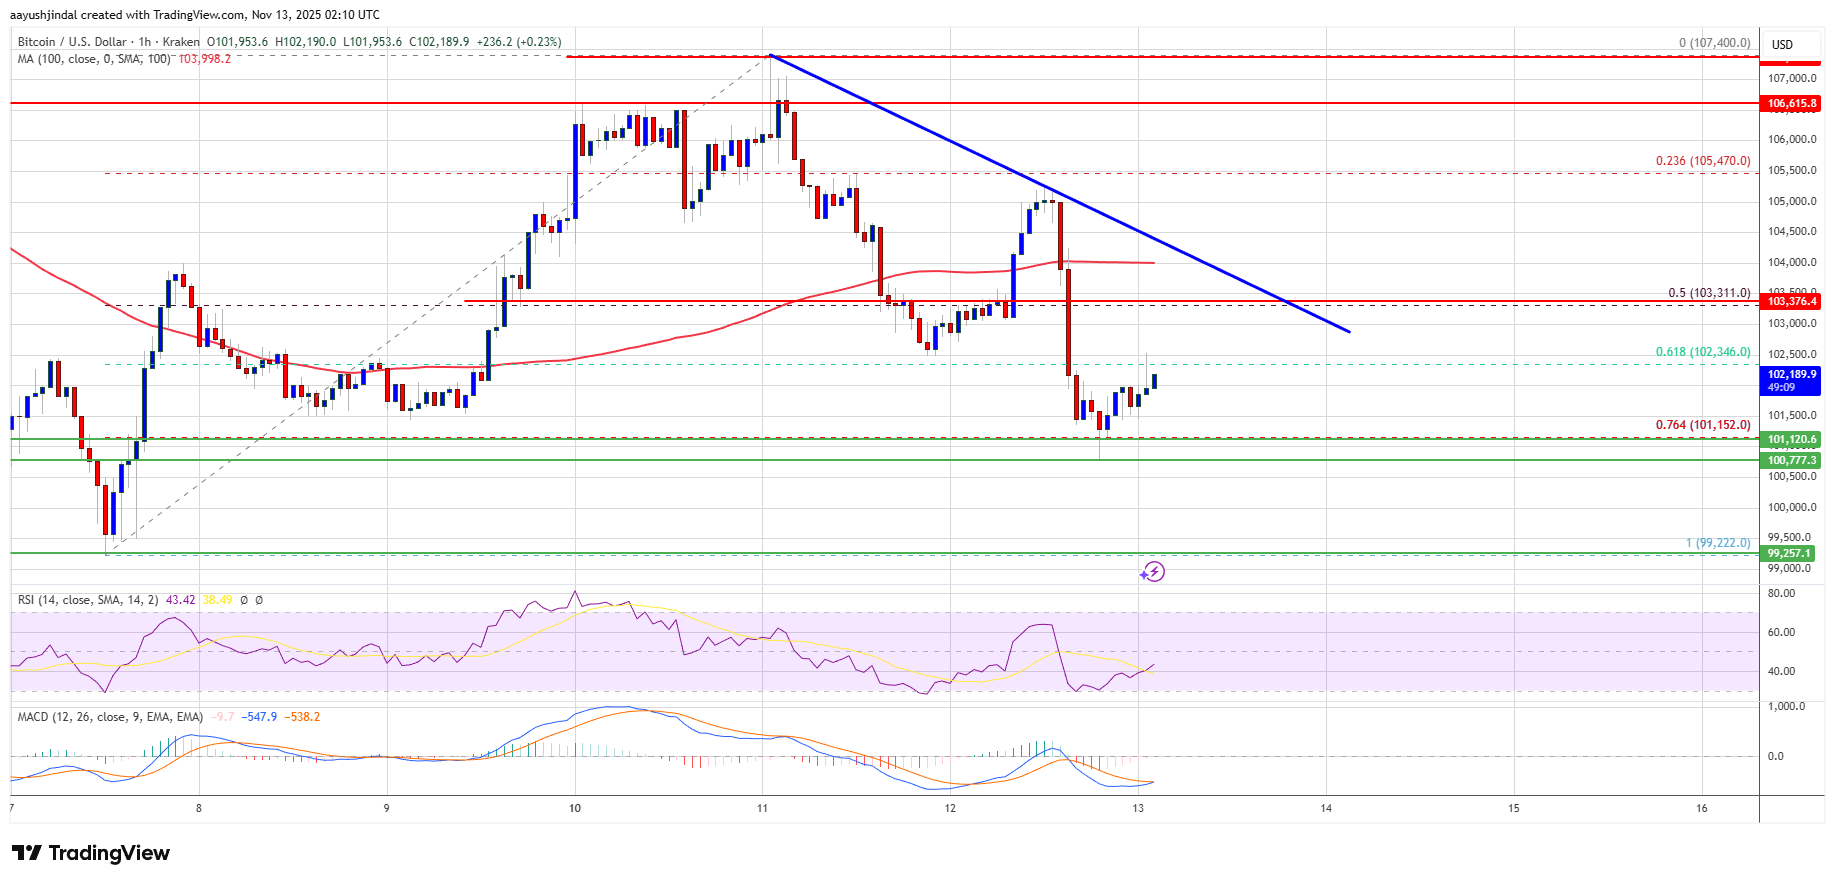
The last swing high was formed at $107,400 before the price started a fresh decline. There was a drop below the $105,000 and $104,000 levels. The price dipped below the 61.8% Fib retracement level of the upward move from the $99,220 swing low to the $107,400 high.
Bitcoin is now trading below $104,000 and the 100 hourly Simple moving average. Besides, there is a bearish trend line forming with resistance at $103,300 on the hourly chart of the BTC/USD pair.
If the bulls attempt another recovery wave, the price could face resistance near the $102,500 level. The first key resistance is near the $103,250 level and the trend line. The next resistance could be $103,500. A close above the $103,500 resistance might send the price further higher. In the stated case, the price could rise and test the $105,000 resistance. Any more gains might send the price toward the $105,500 level. The next barrier for the bulls could be $106,800 and $107,000.
If Bitcoin fails to rise above the $103,500 resistance zone, it could start another decline. Immediate support is near the $101,200 level and the 76.4% Fib retracement level of the upward move from the $99,220 swing low to the $107,400 high. The first major support is near the $100,500 level.
The next support is now near the $100,000 zone. Any more losses might send the price toward the $98,800 support in the near term. The main support sits at $96,500, below which BTC might accelerate lower in the near term.
Technical indicators:
Hourly MACD – The MACD is now gaining pace in the bearish zone.
Hourly RSI (Relative Strength Index) – The RSI for BTC/USD is now below the 50 level.
Major Support Levels – $101,200, followed by $100,500.
Major Resistance Levels – $103,250 and $103,500.
[#item_full_content]NewsBTCRead MoreBarstool Sports founder Dave Portnoy said he will hold bitcoin all the way down to…
Binance founder Changpeng Zhao said Satoshi Nakamoto's bitcoin should be frozen before quantum computers can…
The token hit its highest in over a month during thin July 4 trading, with…
Researchers at Schwab and Hashdex said AI has diverted capital from digital assets while bitcoin…
This cycle, about $697 billion in new money has generated a roughly 689% gain, compared…
Your day-ahead look for July 3, 2026Read MoreCoinDesk: Bitcoin, Ethereum, Crypto News and Price Data[#item_full_content]