Bitcoin price gained bearish momentum and traded below $60,000. BTC is signaling a short-term downtrend and might face hurdles near $62,000.
Bitcoin started a fresh decline from the $62,550 resistance level.
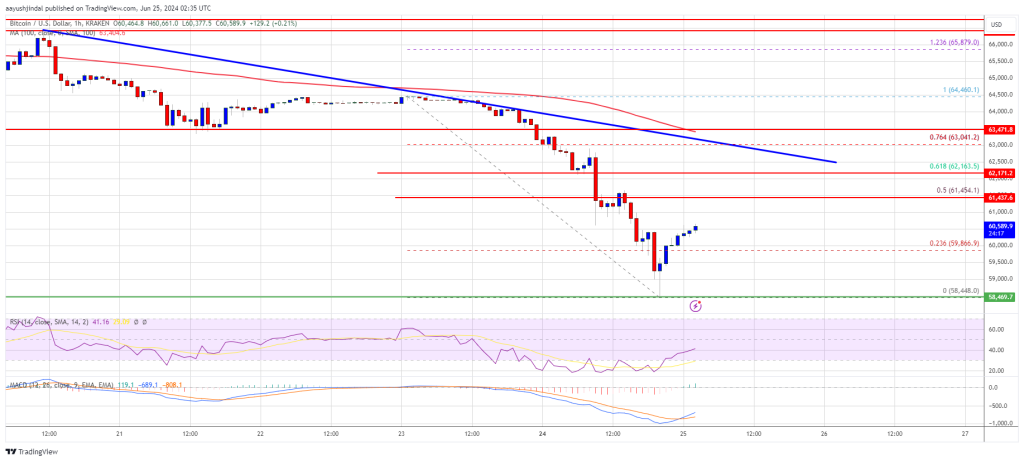
The price is trading below $61,500 and the 100 hourly Simple moving average.
There is a key bearish trend line forming with resistance at $62,400 on the hourly chart of the BTC/USD pair (data feed from Kraken).
The pair could correct higher, but upsides might be limited above the $62,000 resistance zone.
Bitcoin price failed to recover above the $63,500 level. BTC struggled above $63,000 and started another decline. There was a strong decline below the $62,000 and $61,500 levels.
The price even declined below the $60,000 level. A low was formed at $58,448 and the price is now correcting losses. There was a minor increase above the $59,800 level. The price climbed above the 23.6% Fib retracement level of the downward move from the $64,460 swing high to the $58,448 low.
Bitcoin price is now trading below $61,500 and the 100 hourly Simple moving average. If there is a recovery wave, the price could face resistance near the $61,500 level.
The first major resistance could be $62,150 or the 50% Fib retracement level of the downward move from the $64,460 swing high to the $58,448 low. The next key resistance could be $62,500. There is also a key bearish trend line forming with resistance at $62,400 on the hourly chart of the BTC/USD pair.
A clear move above the $62,500 resistance might start a steady increase and send the price higher. In the stated case, the price could rise and test the $63,500 resistance. Any more gains might send BTC toward the $65,000 resistance in the near term.
If Bitcoin fails to climb above the $62,500 resistance zone, it could continue to move down. Immediate support on the downside is near the $61,200 level.
The first major support is $60,000. The next support is now forming near $58,500. Any more losses might send the price toward the $57,000 support zone in the near term.
Technical indicators:
Hourly MACD – The MACD is now gaining pace in the bearish zone.
Hourly RSI (Relative Strength Index) – The RSI for BTC/USD is now below the 50 level.
Major Support Levels – $61,200, followed by $60,000.
Major Resistance Levels – $62,150, and $62,500.
[#item_full_content]NewsBTCRead MoreBitcoin price failed to extend its recovery wave above the $70,500 zone. BTC is now…
Bitcoin Magazine Coinbase CPO Rejects Claims of Opposing Bitcoin Tax Relief as Jack Dorsey Demands…
The security architecture surrounding Bitcoin continues to evolve as new infrastructure emerges to support self-custody…
Bitcoin is up about 7% from the Sunday lows, even as equities and gold tread…
Bitcoin Magazine Cosmos Health (COSM) Buys $600K in Bitcoin, Expands Digital Asset Treasury Cosmos Health…
Bitcoin Magazine Bitcoin is Now a Global Financial Player as Institutions Take the Helm: Bitwise…