Bitcoin price started a downside correction from the $71,650 resistance zone. BTC is now consolidating and might correct toward the $69,500 support.
Bitcoin struggled above $71,500 and started a downside correction.
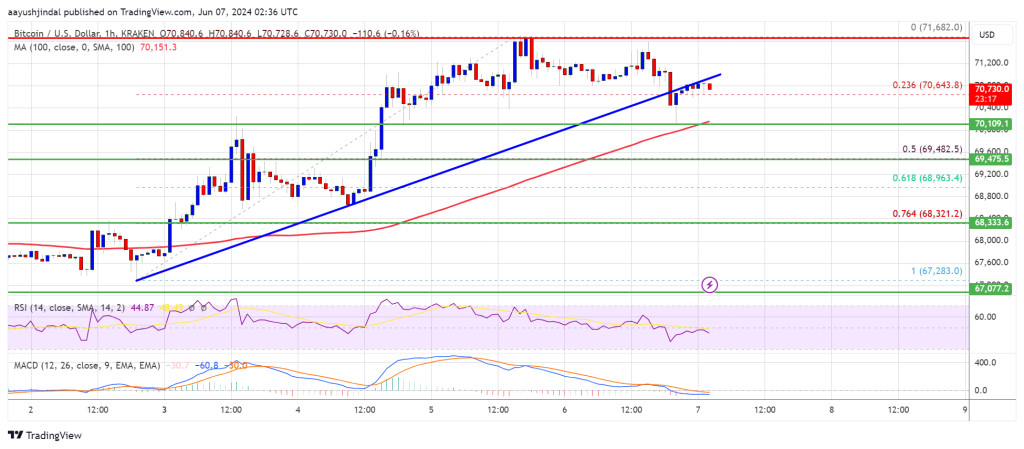
The price is trading above $70,000 and the 100 hourly Simple moving average.
There was a break below a key bullish trend line with support at $70,650 on the hourly chart of the BTC/USD pair (data feed from Kraken).
The pair could decline further if there is a move below the $70,000 level.
Bitcoin price extended its increase above the $70,000 level. BTC was able to clear the $70,500 and $71,200 levels to move further into a positive zone. However, the bears were active near the $71,650 zone.
A high was formed at $71,682 and the price started a downside correction. The price declined below the 23.6% Fib retracement level of the upward wave from the $67,285 swing low to the $71,682 high. There was also a break below a key bullish trend line with support at $70,650 on the hourly chart of the BTC/USD pair.
The price tested the $70,200 support zone. Bitcoin is now trading above $70,000 and the 100 hourly Simple moving average. On the upside, the price is facing resistance near the $70,800 level.
The first major resistance could be $71,200. The next key resistance could be $71,650. A clear move above the $71,650 resistance might send the price higher. In the stated case, the price could rise and test the $72,000 resistance. Any more gains might send BTC toward the $73,200 resistance.
If Bitcoin fails to climb above the $71,200 resistance zone, it could continue to move down. Immediate support on the downside is near the $70,200 level.
The first major support is $70,000. The next support is now forming near $69,500 or the 50% Fib retracement level of the upward wave from the $67,285 swing low to the $71,682 high. Any more losses might send the price toward the $68,500 support zone in the near term.
Technical indicators:
Hourly MACD – The MACD is now losing pace in the bullish zone.
Hourly RSI (Relative Strength Index) – The RSI for BTC/USD is now below the 50 level.
Major Support Levels – $70,200, followed by $70,000.
Major Resistance Levels – $71,200, and $71,650.
[#item_full_content]NewsBTCRead MoreBitcoin Magazine Phong Le Calls Morgan Stanley’s BTC ETF a “Monster Bitcoin” Bet With $160…
For now, surging oil prices and persistent geopolitical tensions are driving inflation fears and weakening…
The Bitcoin price has broken below a legendary support level that had stood strong for…
A global Asian food platform and digital asset firm’s holdings are worth more than twice…
TradFi is taking another step into fully embracing bitcoin as an asset. Morgan Stanley is…
Bitcoin Magazine Bitcoin Price Holds $70,000 as War-Driven Inflation Fears Meet Defensive Market Positioning Bitcoin…