Bitcoin price started a fresh decline from $92,000. BTC is down over 5% and the bulls are struggling to keep the price above $86,500.
Bitcoin started a fresh decline below the $90,000 zone.
The price is trading below $88,000 and the 100 hourly Simple moving average.
There was a break below a key bullish trend line with support at $89,500 on the hourly chart of the BTC/USD pair (data feed from Kraken).
The pair might continue to move down if it settles below the $86,500 zone.
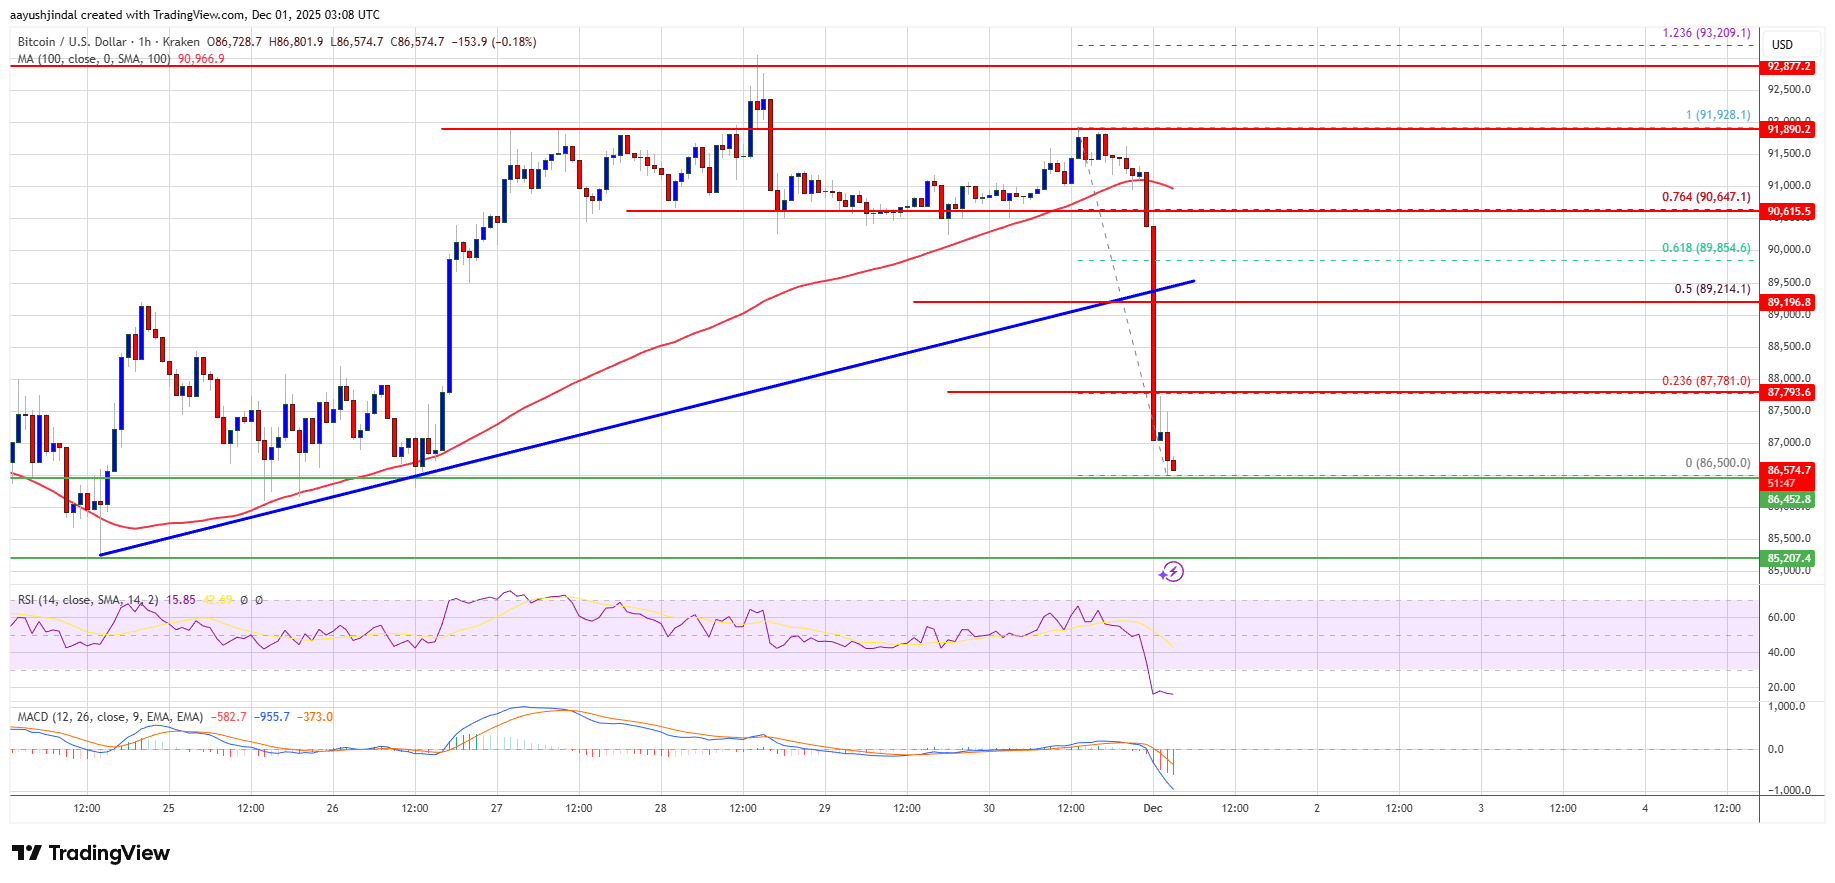
Bitcoin price failed to settle above the $92,000 resistance zone and started a fresh decline. BTC dipped sharply below $90,500 and $90,000.
There was a break below a key bullish trend line with support at $89,500 on the hourly chart of the BTC/USD pair. The pair even spiked below $87,500. A low was formed at $86,500 and the price is now consolidating losses below the 23.6% Fib retracement level of the downward move from the $91,928 swing high to the $86,500 low.
Bitcoin is now trading below $90,000 and the 100 hourly Simple moving average. If the bulls remain in action, the price could attempt another increase. Immediate resistance is near the $87,850 level. The first key resistance is near the $89,200 level or the 50% Fib retracement level of the downward move from the $91,928 swing high to the $86,500 low.
The next resistance could be $89,500. A close above the $89,500 resistance might send the price further higher. In the stated case, the price could rise and test the $90,650 resistance. Any more gains might send the price toward the $91,500 level. The next barrier for the bulls could be $92,000 and $92,500.
If Bitcoin fails to rise above the $87,800 resistance zone, it could start another decline. Immediate support is near the $86,500 level. The first major support is near the $86,000 level.
The next support is now near the $85,500 zone. Any more losses might send the price toward the $83,500 support in the near term. The main support sits at $82,200, below which BTC might accelerate lower in the near term.
Technical indicators:
Hourly MACD – The MACD is now gaining pace in the bearish zone.
Hourly RSI (Relative Strength Index) – The RSI for BTC/USD is now below the 50 level.
Major Support Levels – $86,500, followed by $86,000.
Major Resistance Levels – $87,800 and $89,200.
[#item_full_content]NewsBTCRead MoreThe price of crude oil is tumbling, and U.S. stock futures are moving higher.Read MoreCoinDesk:…
TL;DR Spot Bitcoin ETF products returned to net inflows after five straight days of outflows.…
A pattern stretching back to bitcoin's earliest days has held through every market cycle. It…
TL;DR GameStop’s Form 10-Q includes digital asset custody risk disclosures. The filing discusses circumstances in…
TL;DR Coinbase’s Quantum Advisory Council published a report on post-quantum migration and abandoned coins. The…
TL;DR Crypto Rover says Bitcoin has never bottomed below electrical production cost, currently estimated at…